Fig. 3
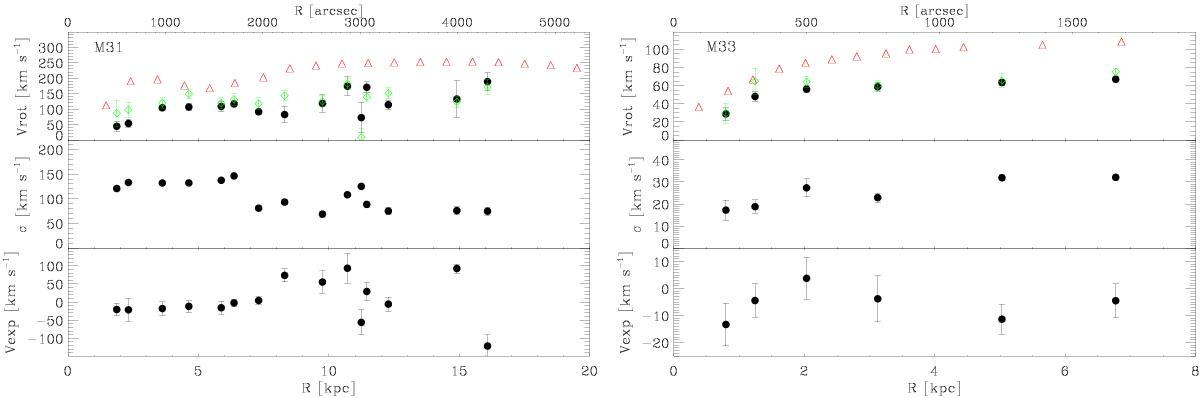
Best-fit rotation curve (upper), velocity dispersion profile (middle), and radial motions (lower) of the PN population in M31 (left panel) and M33 (right panel). Black symbols show the results of fitting Eq. (1); green symbols refer to the results when fixing Vexp = 0; red triangles show the H i rotation curve as a comparison with M31 (Corbelli et al. 2010) and M33 (Corbelli & Salucci 2000). Positive values of Vexp correspond to outflowing motions for both galaxies.
Current usage metrics show cumulative count of Article Views (full-text article views including HTML views, PDF and ePub downloads, according to the available data) and Abstracts Views on Vision4Press platform.
Data correspond to usage on the plateform after 2015. The current usage metrics is available 48-96 hours after online publication and is updated daily on week days.
Initial download of the metrics may take a while.