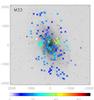
Fig. 2
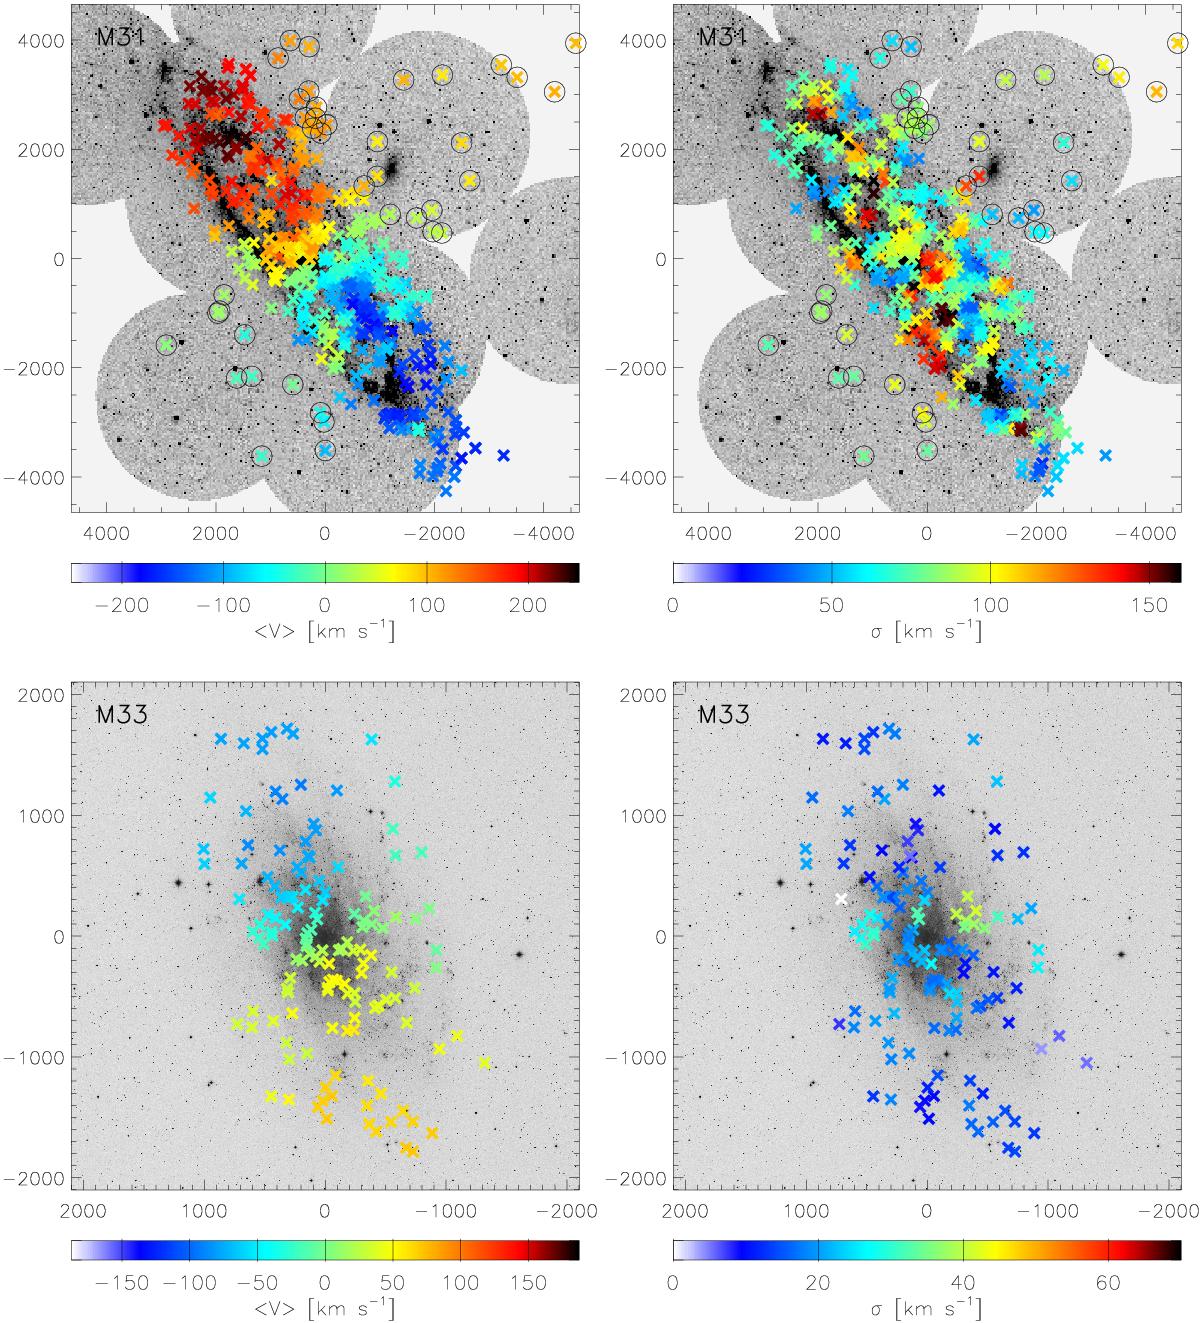
Reconstructed two-dimensional fields of velocity (left panel) and velocity dispersion (right panel) for M31 (upper panels) and M33 (lower panels). Each cross represents the location of a detected PN and its colour indicates the value of ⟨ V ⟩ and ⟨ σ ⟩, as computed via the adaptive Gaussian kernel smoothing in that position. The spatial scale is given in arcsec. North is up; east is left. PNe in M31 that are denoted with an open circle were excluded from the analysis of the rotation curve and radial motions.
Current usage metrics show cumulative count of Article Views (full-text article views including HTML views, PDF and ePub downloads, according to the available data) and Abstracts Views on Vision4Press platform.
Data correspond to usage on the plateform after 2015. The current usage metrics is available 48-96 hours after online publication and is updated daily on week days.
Initial download of the metrics may take a while.