Fig. 12
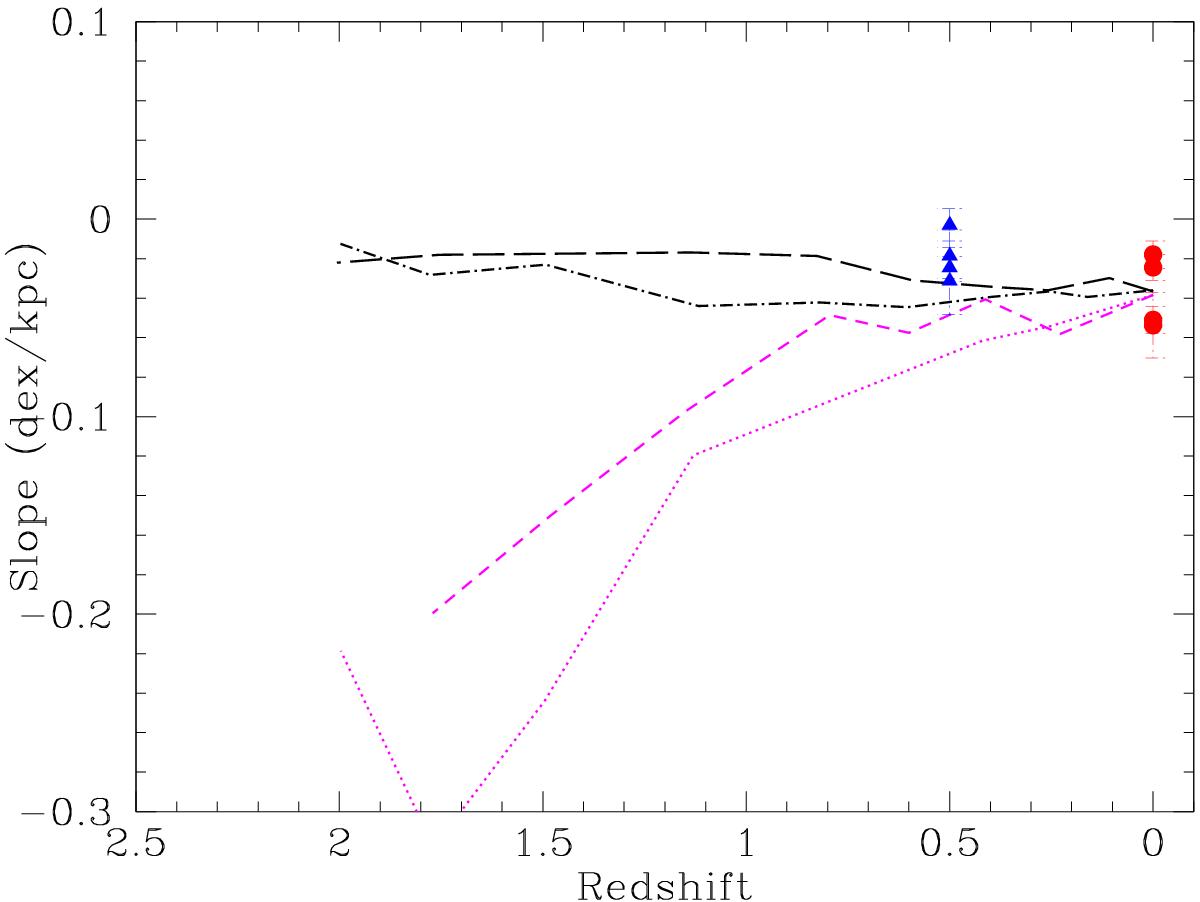
Comparison of the redshift evolution of the gradient with the chemical evolution models of Gibson et al. (2013); black (dashed and dot-dashed) lines are models with enhanced feedback from SNe, magenta (short-dashed and dotted) lines are models with normal feedback. Red circles and blue triangles show the slopes of the gradients from H ii regions and PNe with 1.2 M⊙ progenitors, respectively. In this plot the slopes are expressed in dex/kpc for comparison with the models of Gibson et al. (2013).
Current usage metrics show cumulative count of Article Views (full-text article views including HTML views, PDF and ePub downloads, according to the available data) and Abstracts Views on Vision4Press platform.
Data correspond to usage on the plateform after 2015. The current usage metrics is available 48-96 hours after online publication and is updated daily on week days.
Initial download of the metrics may take a while.