Fig. 11
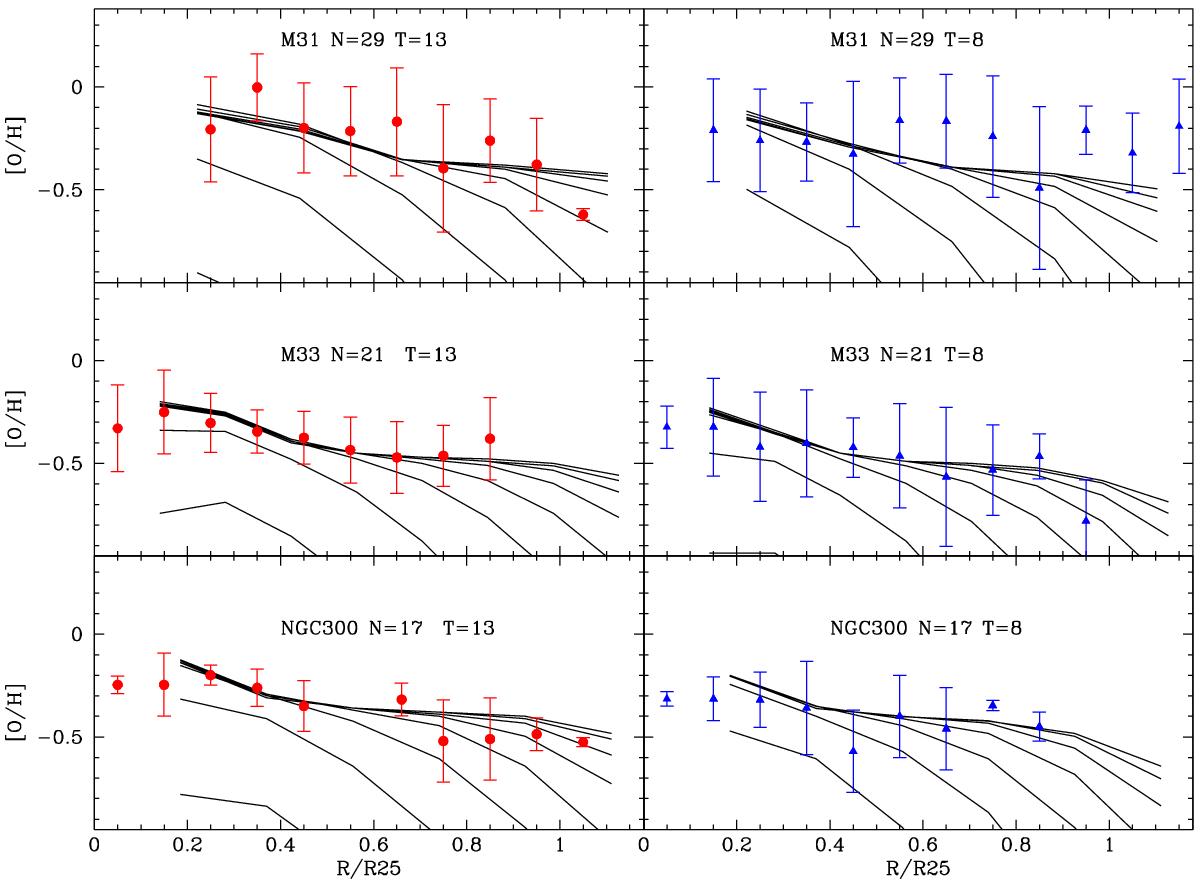
Comparison with the multiphase chemical evolution models of Mollá & Díaz (2005) for galaxies with different mass and star formation efficiencies. Left panels: models at the present time (T = 13 Gyr). Right panels: models at the epoch of PN formation (T = 8 Gyr). Each curve is for a given star formation efficiency. For each galaxy, we chose the most appropriate mass distribution indicated with N in the plots, where N is the designation of the model in Table 1 of Mollá & Díaz (2005).
Current usage metrics show cumulative count of Article Views (full-text article views including HTML views, PDF and ePub downloads, according to the available data) and Abstracts Views on Vision4Press platform.
Data correspond to usage on the plateform after 2015. The current usage metrics is available 48-96 hours after online publication and is updated daily on week days.
Initial download of the metrics may take a while.