Fig. 1
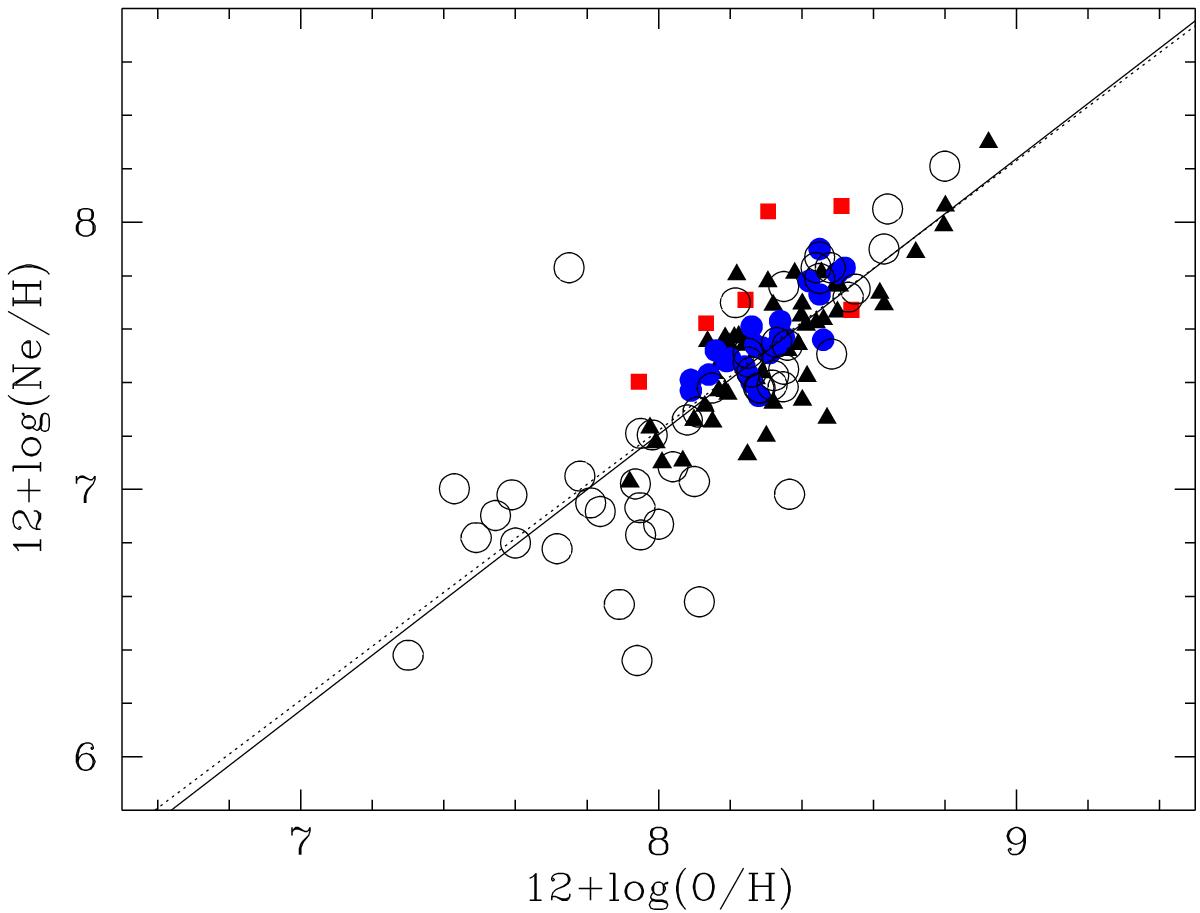
12 + log (O / H) vs. 12 + log (Ne / H) in PNe in M33 (black triangles), M81 (red squares), and NGC 300 (blue filled circles). PNe in Local Group dwarf galaxies are shown as empty circles. The continuous line is the linear fit of the abundances of PNe in the whole sample of galaxies, while the dotted line is Izotov et al. (2006) fit of star-forming galaxies.
Current usage metrics show cumulative count of Article Views (full-text article views including HTML views, PDF and ePub downloads, according to the available data) and Abstracts Views on Vision4Press platform.
Data correspond to usage on the plateform after 2015. The current usage metrics is available 48-96 hours after online publication and is updated daily on week days.
Initial download of the metrics may take a while.