| Issue |
A&A
Volume 588, April 2016
|
|
|---|---|---|
| Article Number | L3 | |
| Number of page(s) | 5 | |
| Section | Letters | |
| DOI | https://doi.org/10.1051/0004-6361/201527784 | |
| Published online | 11 March 2016 | |
Observations and analysis of a curved jet in the coma of comet 67P/Churyumov-Gerasimenko
1
Institute of Astronomy, National Central University,
32054
Chung-Li,
Taiwan
e-mail:
This email address is being protected from spambots. You need JavaScript enabled to view it.
2
Institute of Space Sciences, National Central
University, 32054
Chung-Li,
Taiwan
3
Department of Mechanical Engineering, National Chiao Tung University,
Taiwan
4
Space Science Institute, Macau University of Science and Technology,
Macau
5
Dept. of Earth Science, National Central University,
32054
Chung-Li,
Taiwan
6
Max-Planck Institut für Sonnensystemforschung,
Justus-von-Liebig-Weg, 3,
37077
Göttingen,
Germany
7
Department of Physics and Astronomy “G. Galilei”, University of
Padova, Vic. Osservatorio
3, 35122
Padova,
Italy
8
Centro di Ateneo di Studi ed Attivitá Spaziali “Giuseppe Colombo”,
University of Padova, via Venezia
15, 35131
Padova,
Italy
9
Aix Marseille Université, CNRS, LAM (Laboratoire d’Astro-physique
de Marseille) UMR 7326, 13388
Marseille,
France
10
Centro de Astrobiologia (INTA-CSIC), European Space Agency (ESA),
European Space Astronomy Centre (ESAC), PO Box 78, 28691 Villanueva de la Cañada, Madrid, Spain
11
International Space Science Institute,
Hallerstrasse 6, 3012
Bern,
Switzerland
12
Research and Scientific Support Department,
European Space Agency, 2201
Noordwijk, The
Netherlands
13
PAS Space Research Center, Bartycka 18A,
00716
Warszawa,
Poland
14
Institut für Geophysik und extraterrestrische Physik (IGEP),
Technische Universität Braunschweig, 38106
Braunschweig,
Germany
15
Department for Astronomy, University of Maryland,
College Park, MD
20742-2421,
USA
16
LESIA-Observatoire de Paris, CNRS, UPMC Univ. Paris 06, Univ. Paris-Diderot, 5 place J.
Janssen, 92195
Meudon Principal Cedex,
France
17
LATMOS, CNRS/UVSQ/IPSL, 11 Boulevard dAlembert, 78280
Guyancourt,
France
18
INAF Osservatorio Astronomico di Padova, vic. dell’Osservatorio
5, 35122
Padova,
Italy
19
CNR-IFN UOS Padova LUXOR, via Trasea 7,
35131
Padova,
Italy
20
Department of Physics and Astronomy, Uppsala
University, Box
516, 75120
Uppsala,
Sweden
21
Department of Industrial Engineering, University of
Padova, via Venezia
1, 35131
Padova,
Italy
22
University of Trento, via Sommarive 9, 38123
Trento,
Italy
23
INAF–Osservatorio Astronomico di Trieste, via Tiepolo
11, 34143
Trieste,
Italy
24
Instituto de Astrofísica de Andalucía (CSIC),
c/Glorieta de la Astronomía,
18008
Granada,
Spain
25
Deutsches Zentrum für Luft- und Raumfahrt (DLR), Institut für
Planetenforschung, Rutherfordstrasse 2, 12489
Berlin,
Germany
26
Centre for Astrophysics and Planetary Science, School of Physical
Sciences, The University of Kent, Canterbury
CT2 7NH,
UK
27
Department of Information Engineering, University of
Padova, via Gradenigo
6/B, 35131
Padova,
Italy
28
Physikalisches Institut der Universität Bern,
Sidlerstr. 5, 3012
Bern,
Switzerland
Received: 19 November 2015
Accepted: 28 January 2016
Abstract
Aims. We analyze the physical properties and dynamical origin of a curved jet of comet 67P/Churyumov-Gerasimenko that was observed repeatedly in several nucleus rotations starting on May 30 and persisting until early August, 2015.
Methods. We simulated the motion of dust grains ejected from the nucleus surface under the influence of the gravity and viscous drag effect of the expanding gas flow from the rotating nucleus.
Results. The formation of the curved jet is a combination of the size of the dust particles (~0.1−1 mm) and the location of the source region near the nucleus equator. This enhances the spiral feature of the collimated dust stream after the dust is accelerated to a terminal speed on the order of m s-1.
Key words: comets: individual: 67P/Churyumov-Gerasimenko
© ESO, 2016
1. Introduction
Comets are the most primitive bodies from the outer region of the solar system and are known to be very abundant in volatile ices and refractory dust grains. For a comet with orbital parameters inside 3−4 au, solar radiation raises the surface temperature to such an extent that ice sublimation initiates, as indicated by the appearance of a coma containing expanding gas and small dust particles. Therefore, the outgassing activity increases as the comet approaches perihelion. The behavior of comet 67P Churyumov-Gerasimenko (67P hereafter) follows this pattern closely (Lara et al. 2011; Tozzi et al. 2011; Vincent et al. 2013). In addition to the nearly spherically symmetric coma, anisotropic structures in the form of collimated jets have been identified (Lara et al. 2011; Vincent et al. 2013). The identification of the source mechanism and acceleration process of these dust jets is one of the main aims of the Rosetta mission.
The close-up observations of the OSIRIS scientific camera on the Rosetta spacecraft (Keller et al. 2007) have provided an unprecedented view of the morphology of the near-nucleus coma (Sierks et al. 2015; Thomas et al. 2015). The jet features were visible in the early phases of the rendezvous mission (Lin et al. 2015; Lara et al. 2015), and their development was closely monitored since then. The orientation of its rotational axis and its complex shape together with the rotation period of 12.4 h (Mottola et al. 2015) allowed detecting significant diurnal variations and seasonal effects of the gas flow and dust coma structure (Gulkis et al. 2015; Hässig et al. 2015).
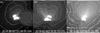 |
Fig. 1 Gradual growth of the dust coma and jets of comet 67P: a) image taken on 5 August, 2014, when the heliocentric distance was rh = 3.60 au, only a small dust jet can be seen emanating from the Hapi region; b) 9 February, 2015, for rh = 2.35 au, the formation of a main jet is accompanied by a few fainter jets originating from other regions; c) 10 May, 2015, for rh = 1.67 au, a system of bright jets appears on the sunward side of the coma. The image contrast level is adjusted to log scale, ranging from −4 to −7. |
Figure 1 shows the time development of the dust coma and jets as 67P approaches the Sun. From August 2014 (rh ~ 3.60 au) to May 2015 (rh ~ 1.67 au), the dust coma became more dense with the same image contrast level. At the beginning, the Hapi region located in the neck between the two lobes appeared to be the main source of the water gas flow (Gulkis et al. 2015; Biver et al. 2015; Hässig et al. 2015) and dust jets (Sierks et al. 2015; Lin et al. 2015; Lara et al. 2015; Vincent et al. 2015). All the dust jets have very straight configurations perpendicular to the surface, suggesting efficient acceleration of the embedded solid grains to radial speeds far exceeding the angular velocity (Vr ~ 1−2 m s-1) of the nucleus because of its rotation. It was therefore surprising that a jet structure with large curvature appeared in late May (Fig. 2). This is the first time that a spiral structure was seen in the near-coma region of a comet, and it was made possible by the close distance of the Rosetta spacecraft to the comet nucleus. Nevertheless, from ground-based observations (Samarasinha & A’Hearn 1991; Lin et al. 2007, 2012, 2013), we also saw a repeated curved appearance of the gaseous and dust jets that was related to the rotation of the nucleus. The curved appearance of the jets might also have been caused by solar gravity and radiation pressure. However, these ground-based observations have much larger scales than Rosetta observations, and the important physical processes might not be the same as the curved jets observed by Rosetta. The curved jets persisted about two months and disappeared in early August, 2015. In this work, we examine the observed properties and dynamics of the curved jet and the localization of its possible source region.
The paper is organized as follows. Section 2 describes the morphology and time variation of the curved jet in comparison to other collimated dust jet features. The results of a set of computations making use of the gravity field model of the comet nucleus and of the direct simulation Monte Carlo (DSMC) simulation are presented in Sect. 3. We discuss the theoretical results and the OSIRIS imaging data in Sect. 4.
2. Observations and data analysis
2.1. Observations on May 30–31
Figure 2 shows the time sequence of the dust coma of 67P in approximately one nucleus rotation on May 30−31, 2015. The sun is toward the top and causes the clear shadow behind the nucleus. The spin axis pointed away from the projection plane with clockwise rotation. According to the shape model (Sierks et al. 2015; Preusker et al. 2015; Jorda et al. 2016), the sub-solar point during this observation was close to the equator of comet 67P. We note that three different components can be identified in Fig. 2a. The brightest one (J1) can be traced to the middle of the Hapi region. On its left side, an array of jets (e.g., J2) becomes clearly visible in Fig. 2b because of the sunlight effect on Imhotep. Last but not least, on the right-hand side a jet (J3) in the form of a spiral arm comes into view in Fig. 2b. It is less discernable in subsequent images as a result of the orientation of the spacecraft relative to the rotating nucleus and/or a decrease in dust production. The spiral jet reappeared again in Fig. 2h just one rotation period later.
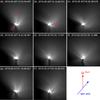 |
Fig. 2 Jet structures obtained with the wide-angle camera from 13:03 UT on May 30 to 07:28 UT on May 31, 2015. Sub-panels a) to h) are separated by about two hours between two frames. The spatial scales and field of view range from 6.72 m/px,13.75 km (panel a)) to 7.01 m/px, 14.36 km (panel h)). |
2.2. Source region of the curved jet
To determine the source region of the curved jet, we used the method described in Lin et al. (2015) and the jet inversion method tracing the orientation of the colliminated beams back to their emission points (Vincent et al. 2016; Lara et al. 2015). The shape model constructed by Jorda et al. (2016) and current SPICE kernels were used for this purpose. Nonetheless, it is difficult to obtain a precise location of the source region from the OSIRIS images taken from late May to early June, 2015, because of the diffusive structure of the jet. The most probable source region is located between Nut and Serget (see Fig. 3 for a context image of where these regions are located on the nucleus). At closer scrutiny, it can be seen that this region is covered by smooth deposits of fine materials that are most likely the result of airfall of low-velocity particles that were unable to escape from the nucleus surface (Thomas et al. 2015; La Forgia et al. 2015, and reference in). However, a more granular deposit including boulders with diameters of up to a few tens of meters can be observed in the Nut region. A part of this area contains pit-like features with diameters smaller than a meter to 4−5 m (see Fig. 7 in La Forgia et al. 2015), which might be remnants formed by wind erosion or sublimation of the volatile-rich blocks. The curved jet appeared for two more months after the first detection. As a consequence, the features of the source region surface might have changed. A study of possible changes in localized areas of the identified source region is only possible in the later phase of the Rosetta mission, however, when high-resolution images at spatial scales as small as 0.5 m/px will be available again.
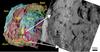 |
Fig. 3 Geological map of 67P observed from the top of the head lobe and nomenclature of the geological regions (modified from Fig. 2 in El-Maarry et al. 2015), and the possible source regions, red circles, of the curved jet. The possible source region is at about 6 degrees latitude in the northern hemisphere. The sub-solar point at the time of the present observation (31 May 2015) is 9 degrees latitude in the southern hemisphere and moves toward higher latitude until the beginning of September, 2015. The right panel is the NAC image obtained on September 19.5, 2014, with a resolution of about 0.53 m/px. |
3. Numerical simulation
To examine the origin and dynamical evolution of the curved jet, we need to consider the trajectories of different dust particles with different sizes under the influence of the gravitational attraction of the nucleus. Because of its highly irregular shape, the gravitational field was computed by dividing the whole object into 33681 elements - according to the shape model with homogeneous structure and a bulk density of 532 kg m-3 (Jorda et al. 2016). Figure 4a shows the contour plot of the gravitational field in the vicinity of the nucleus. At distances larger than three nucleus radii (~6 km), the gravitational field can be reasonably well approximated by that from a point mass. However, close to the nucleus surface, the field distribution is far from spherical symmetry.
Figure 4b shows the flow field of the coma gas expanding from the nucleus surface. To treat the transition from a collisional region close to the central nucleus to the collisionless coma at large distance, a direct simulation Monte Carlo (DSMC) method is required (Bird 1994). The basic structure of the DSMC code used for obtaining this result has been described in detail in Wu et al. (2004), Su et al. (2010), Lai et al. (2015), and Liao et al. (2016) and is not repeated here. For this simulation, we assumed that the water production rate is 1027 molecules s-1 and the sunlit portion of the nucleus surface at the time of consideration was assumed to be all actively outgassing. Thus, the uniform gas production rate on the sunlit side is Z = 4.8 × 10¹⁹ H2O molecules m-2 s-1. The initial velocity distribution of the gas is described by a half-Maxwellian distribution with a thermal temperature of 228 K. The sunlit side was assumed to be free of gas outflow, even though we know this is not necessarily true according to the Rosina measurements (Hässig et al. 2015) and the recent discovery of the so-called night-side outbursts or sunset jet activities by the OSIRIS camera team (Knollenberg et al. 2015, and Shi et al. 2016). It is clear that a certain level of weak outgassing activity existed on the night-side of the nucleus. There might also be activity driven by other gases (CO2) – as may be the case for both the sunrise and the sunset jets, as was reported by Haessig (CO2/H2O = 4). However, even under such circumstances, the number distribution of the gas molecules should be highly non-isotropic within 5−10 nucleus radii covered by the simulation box. In a different study (Lai et al. 2015), it has been demonstrated that the global gas flows tend to follow streamlines perpendicular to the surface of their source regions if the gas emission rate (Z) on the illuminated side is assumed to be proportional to square root cosθ, where θ is the solar zenith angle where θ> 0. For the whole surface, Z = 0.1 × Z0 , where Z0 is the peak sublimation rate at θ = 0. It is interesting to note that even for localized outburst events, the dust jets appeared to be highly collimated (J.-B. Vincent, priv. comm.).
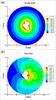 |
Fig. 4 a) A contour plot of the gravitational field of comet 67P in the XY plane containing the long and short axes. The rotational axis is in the perpendicular direction. The assumed bulk density is ρ = 532 kg m-3. b) The flow field of the expanding gas outflow. |
In the simulation code, the motion of a dust particle of mass m with initial zero velocity is determined by the viscous drag effect of the expanding gas flow and the gravitational attraction of the nucleus. We note that the effects of solar radiation pressure on a curved jet are not considerable in our simulation, but will be involved in the future. The equation of motion is (Gombosi et al. 1986; Skorov et al. 1999; Molina et al. 2008) 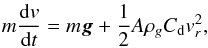 (1)where m is the mass of dust particle and g is the local gravity. The second term on the right-hand side represents the gas drag effect. The dust particle of cross section A is assumed to be spherical and its density (ρ) is taken to be 1000 kg m-3 (Fulle et al. 2015). In Eq. (1), vr is the relative velocity between the gas molecules and the dust particle, ρg is the mass density of the gas flow, and Cd is the drag coefficient. We note that Cd = 2 (Wallis 1982).
To demonstrate the combined effect of the gas drag and nucleus gravity, a source region was tentatively chosen in the Nut region (see Fig. 3) with zero initial velocity. The general idea is to examine the dependence of particle size, gas production rate, and emission location on the jet dynamics.
4. Result and conclusions
Figure 5a illustrates the obtained velocity profiles of dust grains with radii ranging between 1 μm and 1 mm for the gas sublimation rate of Z = 4.8 × 10¹⁹ H2O molecules m-2 s-1. The larger dust grains will be accelerated to lower radial velocity as compared with the particles of smaller sizes. This effect can be understood in terms of the size dependence of the gas drag force under the influence of the gravitational attraction of the comet nucleus. In addition, the dust grains are accelerated to their terminal speeds within a distance of about 2 km or slightly more in all the considered cases. The small micron-size dust could reach an outflow speed as high as 30 m s-1 , while mm-size dust grains have a terminal speed of about 0.5 m s-1 (or lower), which is similar to the rotational speed of the nucleus at its surface. This immediately suggests that the grains in the curved jet must be relatively large (i.e., d ~ 0.1−1 mm). The result is consistent with previous findings (Rotundi et al. 2015) that the optically dominant particles in the coma of 67P are exactly of a size of 0.1−1 mm. In addition to the curved jet, the straight jets (Fig. 2 J1 and J2) might consist of relative smaller particles. The identification of the exact sizes would depend on the characteristics of the surface material and the effective outgassing rate that controls the gas drag acceleration.
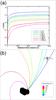 |
Fig. 5 a) Velocity profiles of dust grains of different sizes with sublimation rate Z = 4.8 × 10¹⁹ H2O molecules m-2 s-1. b) Trajectories of dust grains of different radii (from 1 μm to 1 mm) as the nucleus rotates. |
It is perhaps not by chance that the curved jet was observed to be emitted near the equatorial region of the head of 67P (Nut, Serqet, and Ma’at), that is, at a location where the nucleus rotation speed is highest. As mentioned before in Sect. 2, the collimated jets of linear configuration seemed to have all been emanated from the Hapi region, that is, more or less along the spin axis, where the centrifugal force is minimal.
From our data analysis and preliminary numerical simulation, it is now understood that the appearance of a curved jet in May and June 2015 is caused by a combined ejection of mm-size dust grains from the equatorial source region in the vicinity of Nut, Serqet, and Ma’at. This unique set of OSIRIS observations provides important information on the physical properties of the dust grains and on the acceleration process.
Acknowledgments
OSIRIS was built by a consortium led by the Max-Planck-Institut für Sonnensystemforschung, Göttingen, Germany, in collaboration with CISAS, University of Padova, Italy, the Laboratoire d’Astrophysique de Marseille, France, the Instituto de Astrofísica de Andalucía, CSIC, Granada, Spain, the Scientific Support Office of the European Space Agency, Noordwijk, Netherlands, the Instituto Nacional de Técnica Aeroespacial, Madrid, Spain, the Universidad Politéchnica de Madrid, Spain, the Department of Physics and Astronomy of Uppsala University, Sweden, and the Institut für Datentechnik und Kommunikationsnetze der Technischen Universität Braunschweig, Germany. The support of the national funding agencies of Germany (Deutschen Zentrums für Luft- und Raumfahrt), France (Centre National d’Études Spatiales), Italy (Agenzia Spaziale Italiana), Spain (Ministerio de Educación, Cultura y Deporte), Sweden (Swedish National Space Board; grant no. 74/10:2), and the ESA Technical Directorate is gratefully acknowledged. This work was also supported by grant number NSC 102-2112-M-008-013-MY3 and MOST 104-2119-M-008-024 from the Ministry of Science and Technology of Taiwan. We are indebted to the whole Rosetta mission team, Science Ground Segment, and Rosetta Mission Operation Control for their hard work making this mission possible.
References
- Bird, G. 1994, Molecular gas dynamics and the direct simulation of gas flows (Oxford) [Google Scholar]
- Biver, N., Hofstadter, M., Gulkis, S., et al. 2015, A&A, 583, A3 [NASA ADS] [CrossRef] [EDP Sciences] [Google Scholar]
- El-Maarry, M. R., Thomas, N., Giacomini, L., et al. 2015, A&A, 583, A26 [NASA ADS] [CrossRef] [EDP Sciences] [Google Scholar]
- Fulle, M., Della Corte, V., Rotundi, A., et al. 2015, ApJ, 802, L12 [NASA ADS] [CrossRef] [Google Scholar]
- Gombosi, T. I., Nagy, A. F., & Cravens, T. E. 1986, Rev. Geophys., 24, 667 [NASA ADS] [CrossRef] [Google Scholar]
- Gulkis, S., Allen, M., Allmen, P., et al. 2015, Science, 347, 0709 [Google Scholar]
- Hässig, M., Altwegg, K., Balsiger, H., et al. 2015, Science, 347, 0276 [CrossRef] [Google Scholar]
- Jorda, L., Gaskell, R., Capanna, C., et al. 2016, Icarus, submitted [Google Scholar]
- Keller, H. U., Barbieri, C., Lamy, P., et al. 2007, Space Sci. Rev., 128, 433 [NASA ADS] [CrossRef] [Google Scholar]
- Knollenberg, J., Lin, Z. Y., & Hviid, S. F. 2015, A&A, submitted [Google Scholar]
- La Forgia, F., Giacomini, L., Lazzarin, M., et al. 2015, A&A, 583, A18 [Google Scholar]
- Lai, I.-L., et al. 2015, Earth Moon Planets, in press [Google Scholar]
- Lara, L., Lin, Z.-Y., Rodrigo, R., & Ip, W.-H. 2011, A&A, 525, A36 [NASA ADS] [CrossRef] [EDP Sciences] [Google Scholar]
- Lara, L., Lowry, S., Vincent, J.-B., et al. 2015, A&A, 583, A9 [Google Scholar]
- Liao, Y., Su, C. C., Marschall, R., et al. 2016, Earth Moon Planets, in press [Google Scholar]
- Lin, Z. Y., Weiler, M., Rauer, H., & Ip, W. H. 2007, A&A, 469, 771 [NASA ADS] [CrossRef] [EDP Sciences] [Google Scholar]
- Lin, Z.-Y., Lara, L. M., Vincent, J. B., & Ip, W.-H. 2012, A&A, 537, A101 [NASA ADS] [CrossRef] [EDP Sciences] [Google Scholar]
- Lin, Z.-Y., Lara, L. M., & Ip, W.-H. 2013, AJ, 146, 4 [NASA ADS] [CrossRef] [Google Scholar]
- Lin, Z.-Y., Ip, W.-H., Lai, I.-L., et al. 2015, A&A, 583, A11 [NASA ADS] [CrossRef] [EDP Sciences] [Google Scholar]
- Molina, A., Moreno, F., & Jiménez-Fernández, F. J. 2008, Earth Moon Planets, 102, 521 [NASA ADS] [CrossRef] [Google Scholar]
- Preusker, F., Scholten, F., Matz, K.-D., et al. 2015, A&A, 583, A33 [NASA ADS] [CrossRef] [EDP Sciences] [Google Scholar]
- Rotundi, A., Sierks, H., Della Corte, V., et al. 2015, Science, 347, 3905 [Google Scholar]
- Samarasinha, N. H., & A’Hearn, M. F. 1991, Icarus, 93, 194 [NASA ADS] [CrossRef] [Google Scholar]
- Shi, X., Hu, X., Sierks, H., et al. 2016, A&A, 586, A7 [NASA ADS] [CrossRef] [EDP Sciences] [Google Scholar]
- Sierks, H., Barbieri, C., Lamy, P., et al. 2015, Science, 347, 1044 [NASA ADS] [CrossRef] [Google Scholar]
- Skorov, Y. V., Kömle, N. I., Markiewicz, W. J., & Keller, H. U. 1999, Icarus, 140, 173 [NASA ADS] [CrossRef] [Google Scholar]
- Su, C., Tseng, K., Cave, H., et al. 2010, Comput. Fluids, 39, 1136 [CrossRef] [Google Scholar]
- Thomas, N., Sierks, H., Barbieri, C., et al. 2015, Science, 347, 0440 [CrossRef] [Google Scholar]
- Tozzi, G. P., Patriarchi, P., Boehnhardt, H., et al. 2011, A&A, 531, A54 [NASA ADS] [CrossRef] [EDP Sciences] [Google Scholar]
- Vincent, J.-B., Lara, L. M., Tozzi, G. P., Lin, Z.-Y., & Sierks, H. 2013, A&A, 549, A121 [NASA ADS] [CrossRef] [EDP Sciences] [Google Scholar]
- Vincent, J.-B., Bodewits, D., Besse, S., et al. 2015, Nature, 523, 63 [NASA ADS] [CrossRef] [Google Scholar]
- Vincent, J.-B., Oklay, N., Pajola, M., et al. 2016, A&A, 587, A14 [NASA ADS] [CrossRef] [EDP Sciences] [Google Scholar]
- Wallis, M. 1982, in Comets, A83-13376 03-90 (Tucson, AZ: University of Arizona Press) [Google Scholar]
- Wu, J.-S., Tseng, K.-C., & Wu, F.-Y. 2004, Comp. Phys. Comm., 162, 166 [Google Scholar]
All Figures
|
Fig. 1 Gradual growth of the dust coma and jets of comet 67P: a) image taken on 5 August, 2014, when the heliocentric distance was rh = 3.60 au, only a small dust jet can be seen emanating from the Hapi region; b) 9 February, 2015, for rh = 2.35 au, the formation of a main jet is accompanied by a few fainter jets originating from other regions; c) 10 May, 2015, for rh = 1.67 au, a system of bright jets appears on the sunward side of the coma. The image contrast level is adjusted to log scale, ranging from −4 to −7. |
| In the text | |
|
Fig. 2 Jet structures obtained with the wide-angle camera from 13:03 UT on May 30 to 07:28 UT on May 31, 2015. Sub-panels a) to h) are separated by about two hours between two frames. The spatial scales and field of view range from 6.72 m/px,13.75 km (panel a)) to 7.01 m/px, 14.36 km (panel h)). |
| In the text | |
|
Fig. 3 Geological map of 67P observed from the top of the head lobe and nomenclature of the geological regions (modified from Fig. 2 in El-Maarry et al. 2015), and the possible source regions, red circles, of the curved jet. The possible source region is at about 6 degrees latitude in the northern hemisphere. The sub-solar point at the time of the present observation (31 May 2015) is 9 degrees latitude in the southern hemisphere and moves toward higher latitude until the beginning of September, 2015. The right panel is the NAC image obtained on September 19.5, 2014, with a resolution of about 0.53 m/px. |
| In the text | |
|
Fig. 4 a) A contour plot of the gravitational field of comet 67P in the XY plane containing the long and short axes. The rotational axis is in the perpendicular direction. The assumed bulk density is ρ = 532 kg m-3. b) The flow field of the expanding gas outflow. |
| In the text | |
|
Fig. 5 a) Velocity profiles of dust grains of different sizes with sublimation rate Z = 4.8 × 10¹⁹ H2O molecules m-2 s-1. b) Trajectories of dust grains of different radii (from 1 μm to 1 mm) as the nucleus rotates. |
| In the text | |
Current usage metrics show cumulative count of Article Views (full-text article views including HTML views, PDF and ePub downloads, according to the available data) and Abstracts Views on Vision4Press platform.
Data correspond to usage on the plateform after 2015. The current usage metrics is available 48-96 hours after online publication and is updated daily on week days.
Initial download of the metrics may take a while.