Fig. 6
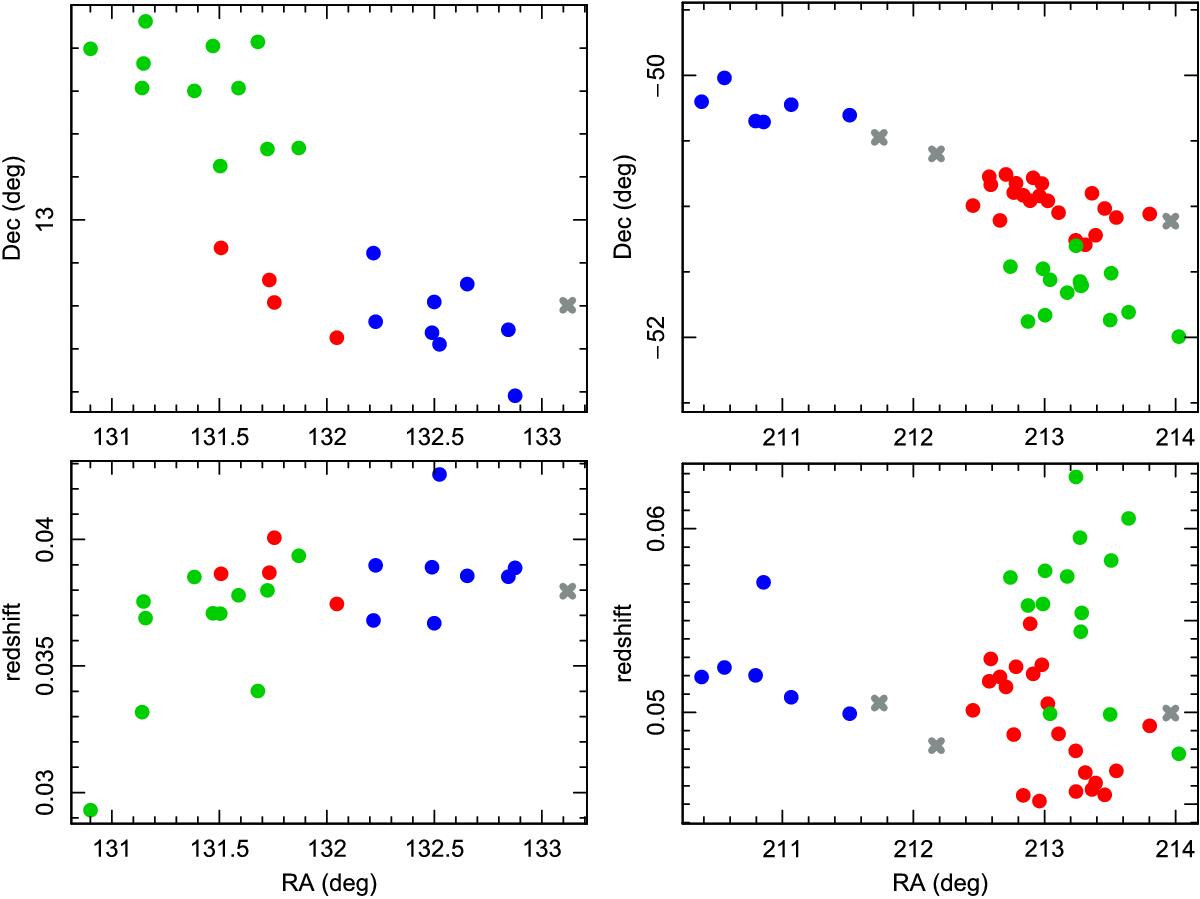
Example of two galaxy groups (in left- and right-hand panels, respectively) as detected by the FoF algorithm. Galaxy positions are shown in RA-Dec (upper panels) and redshift-Dec (lower panels) coordinates. The conventional FoF method sees both systems as single groups, while the multimodality analysis has split them into subsystems, indicated with different colours (see Sect. 3.2.1 for details). Grey crosses represent galaxies that do not belong to any subsystem; these galaxies were removed during the final group membership refinement, as explained in Sect. 3.2.2. The right-hand panels show that the blue subgroup is connected with the others by the initial FoF detection because of the two central galaxies, which were identified as outliers in the subsequent analysis. The figure illustrates that membership refinement may be of critical importance for richer groups detected with FoF algorithm.
Current usage metrics show cumulative count of Article Views (full-text article views including HTML views, PDF and ePub downloads, according to the available data) and Abstracts Views on Vision4Press platform.
Data correspond to usage on the plateform after 2015. The current usage metrics is available 48-96 hours after online publication and is updated daily on week days.
Initial download of the metrics may take a while.