Fig. 10
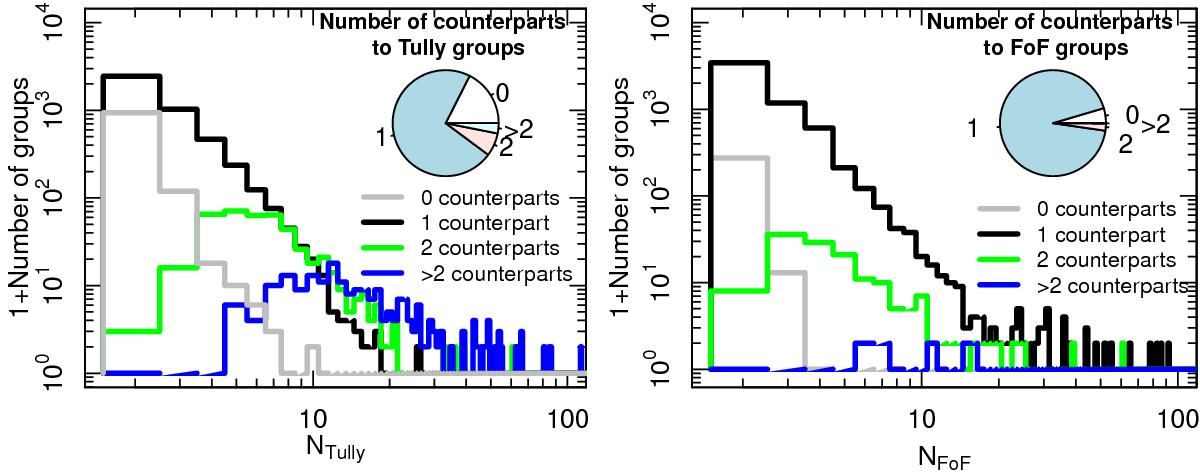
Distribution of matching groups as a function of group richness in Tully (2015b) and in our FoF catalogue. In the left panel, counterparts for each Tully group are sought from the FoF catalogue, in the right panel vice versa. Different lines correspond to groups with zero, one, two, or more matches in the comparison catalogue (see text for more details). Groups with more matches are generally richer, groups with zero matches poorer systems. The inset pie diagrams show the fractions of groups with a given amount of counterparts. Table 1 shows the numbers and fractions of groups contained in each sector.
Current usage metrics show cumulative count of Article Views (full-text article views including HTML views, PDF and ePub downloads, according to the available data) and Abstracts Views on Vision4Press platform.
Data correspond to usage on the plateform after 2015. The current usage metrics is available 48-96 hours after online publication and is updated daily on week days.
Initial download of the metrics may take a while.