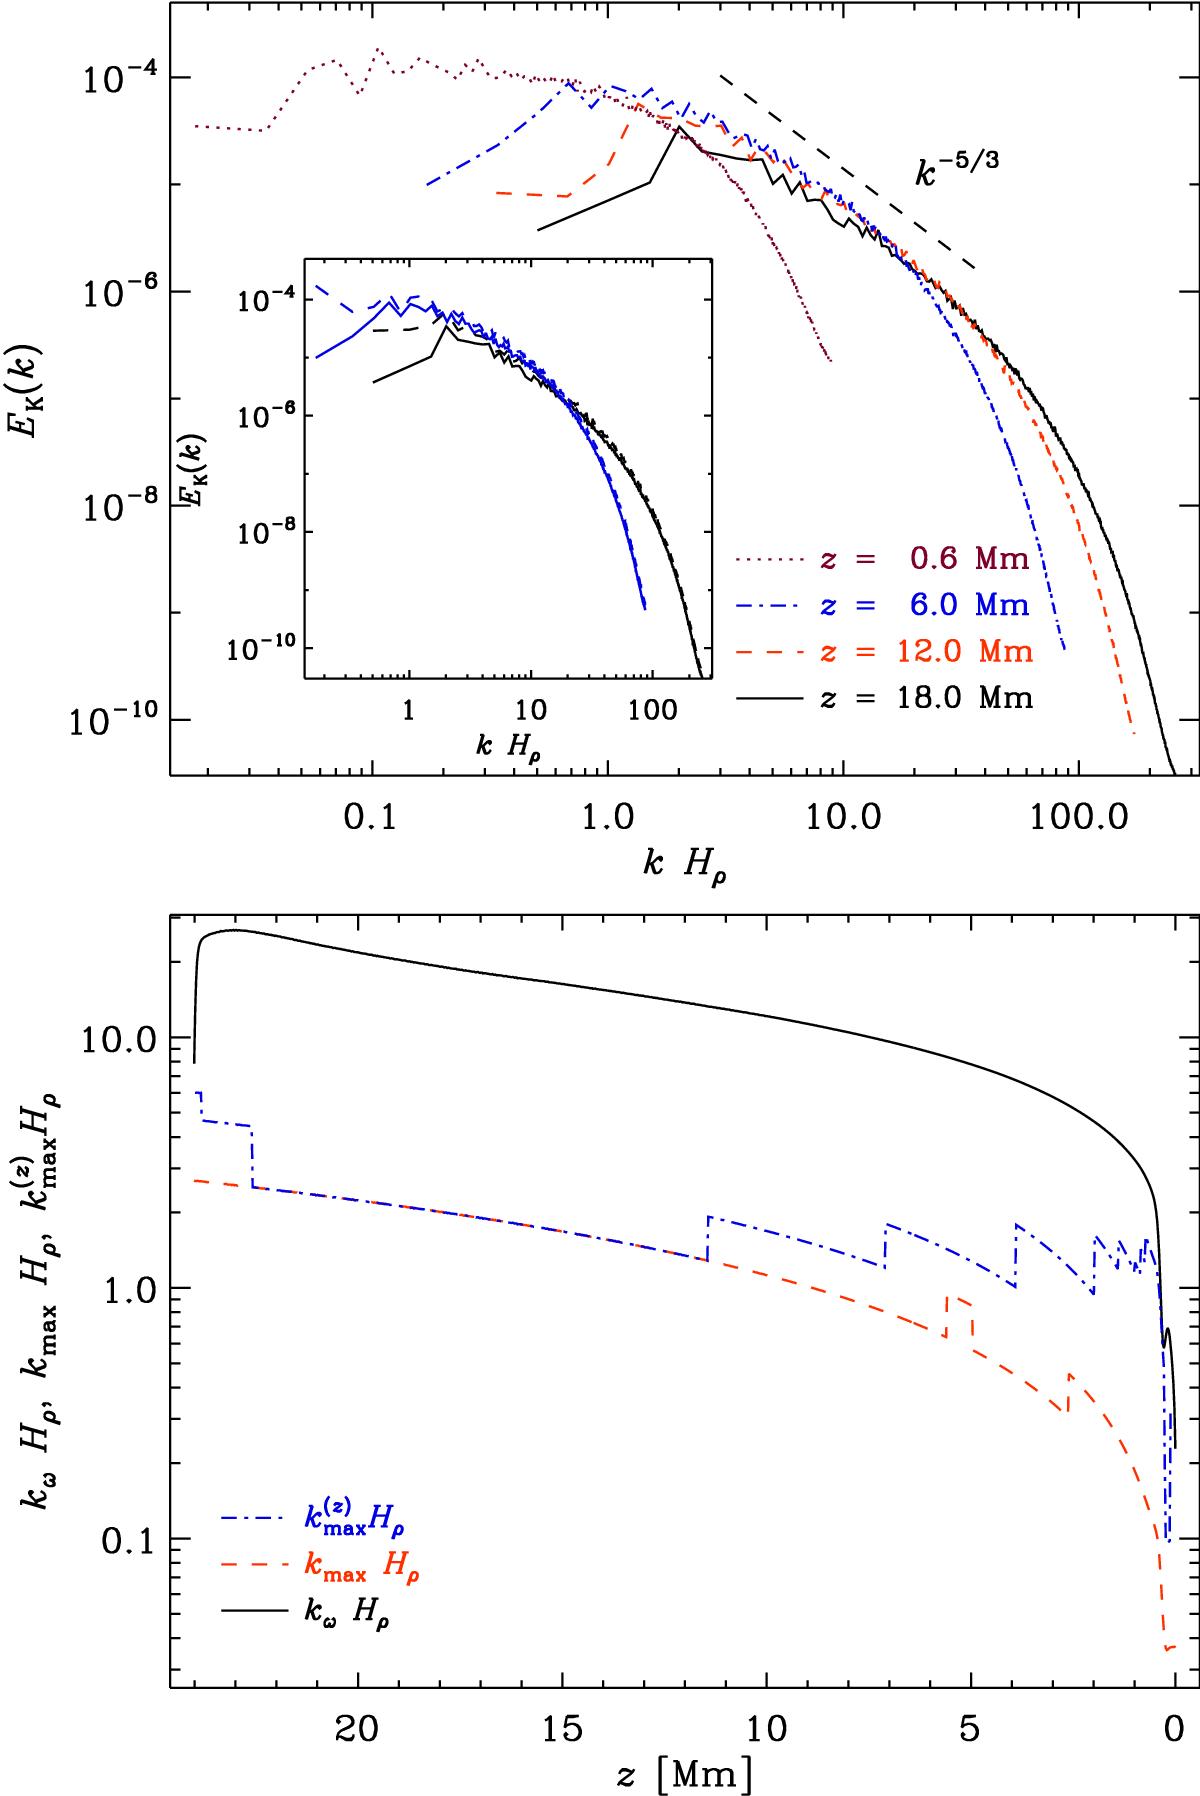
Fig. 13

Top panel: power spectra of the fluctuating velocity from four horizontal planes as indicated in the legend in Run C1v. The horizontal wavenumber is made non-dimensional by multiplying with the density scale height Hρ at the same depth. The dashed line shows the slope for Kolmogorov k− 5/3 scaling. The inset shows a comparison of power spectra of the full velocity field (dashed lines) and the fluctuating velocity from which the temporal average is removed (solid lines) from depths 6 Mm (blue) and 18 Mm (black). Bottom panel: wavenumbers corresponding to Taylor microscale (black solid line; see Eq. (16)), and the peaks of the fluctuating velocity power spectra (red dashed) and the fluctuating vertical velocity (blue dash-dotted) spectra as functions of depth and normalized by Hρ.
Current usage metrics show cumulative count of Article Views (full-text article views including HTML views, PDF and ePub downloads, according to the available data) and Abstracts Views on Vision4Press platform.
Data correspond to usage on the plateform after 2015. The current usage metrics is available 48-96 hours after online publication and is updated daily on week days.
Initial download of the metrics may take a while.


