Fig. 10
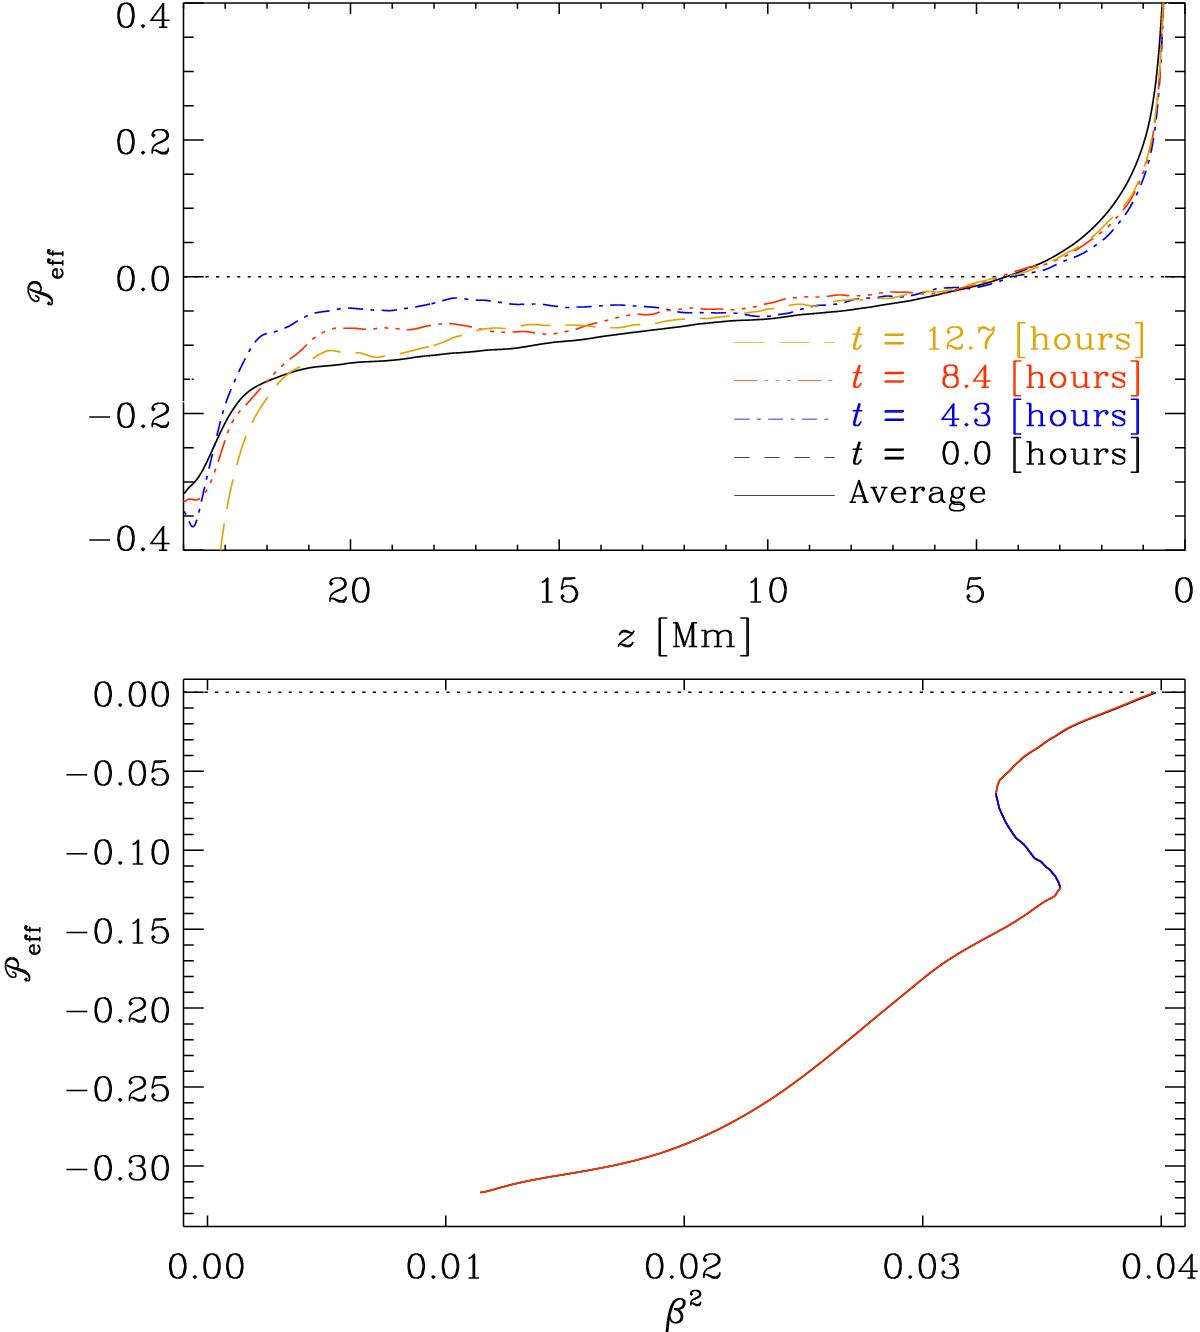
Top panel: effective magnetic pressure ![]() as a function of height for Run C2v. The solid black line shows the time averaged data, whereas the other curves show instantaneous data from times indicated in the legend. Bottom panel:
as a function of height for Run C2v. The solid black line shows the time averaged data, whereas the other curves show instantaneous data from times indicated in the legend. Bottom panel: ![]() as a function of β2 in regions where
as a function of β2 in regions where ![]() for the temporally averaged data from the top panel. Red (blue) part of the curve indicates
for the temporally averaged data from the top panel. Red (blue) part of the curve indicates ![]() (
(![]() ).
).
Current usage metrics show cumulative count of Article Views (full-text article views including HTML views, PDF and ePub downloads, according to the available data) and Abstracts Views on Vision4Press platform.
Data correspond to usage on the plateform after 2015. The current usage metrics is available 48-96 hours after online publication and is updated daily on week days.
Initial download of the metrics may take a while.