Fig. 5
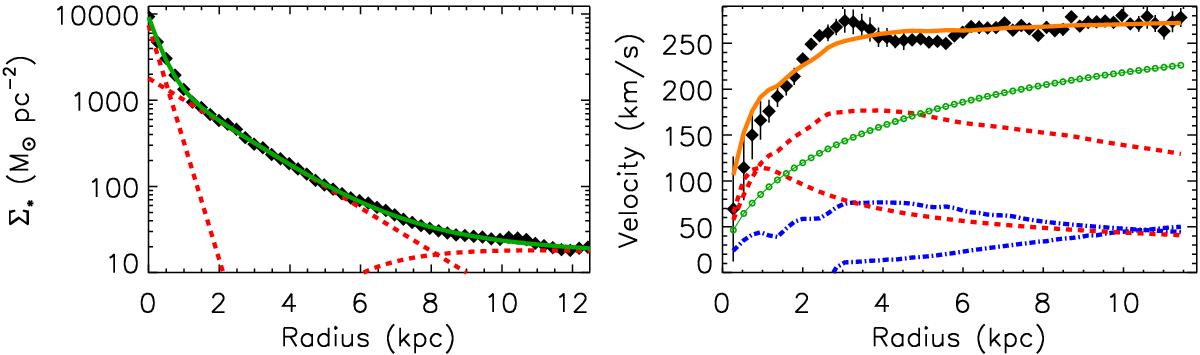
Left: mass surface density profile of stars in M 99. A bulge-disk decomposition model (green solid line) to the observed profile (symbols) is seen, as well as bulge and disk components (red dashed lines). Right: axisymmetric mass distribution model of M 99. The rotation curve is represented with filled symbols, and its model with an orange solid line. Contributions from the stellar bulge and disk are shown with red dashed lines, from the atomic and molecular gas disks with blue dash-dotted lines, and from the dark matter component with green open symbols. The dark matter model is the best-fit NFW halo whose parameters are given in Table D.1.
Current usage metrics show cumulative count of Article Views (full-text article views including HTML views, PDF and ePub downloads, according to the available data) and Abstracts Views on Vision4Press platform.
Data correspond to usage on the plateform after 2015. The current usage metrics is available 48-96 hours after online publication and is updated daily on week days.
Initial download of the metrics may take a while.