Fig. 3
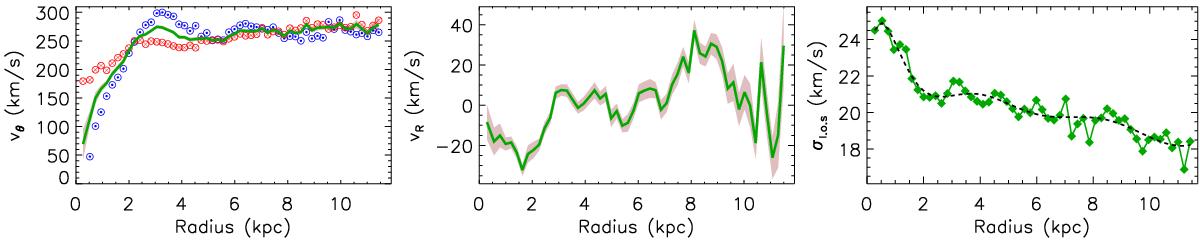
Left and middle: profiles of tangential and radial velocity of M 99. Shaded area indicates the 1σ rms from the fittings. A green solid line represents the fitting for the whole disk, while blue dotted and red crossed circles are respectively the results for the approaching and receding sides fitted separately. Right panel: Hα velocity dispersion of M 99. Symbols represent the observed dispersion; the dashed line is a smooth model of the observation used to derive the asymmetric drift.
Current usage metrics show cumulative count of Article Views (full-text article views including HTML views, PDF and ePub downloads, according to the available data) and Abstracts Views on Vision4Press platform.
Data correspond to usage on the plateform after 2015. The current usage metrics is available 48-96 hours after online publication and is updated daily on week days.
Initial download of the metrics may take a while.