Fig. 10
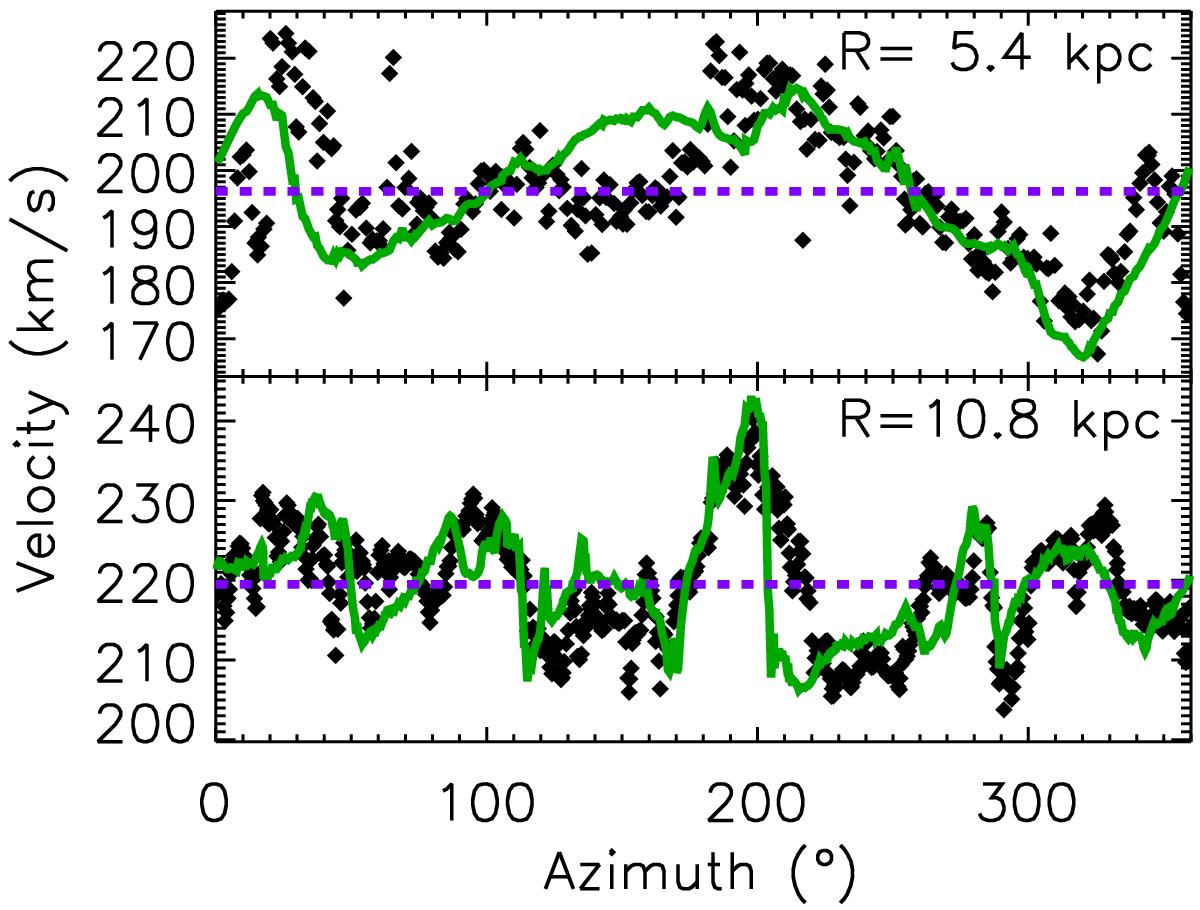
Azimuthal velocity profiles at R = 5.4 and 10.8 kpc in the simulation of the MW-like galaxy of Kawata et al. (2014b). Filled symbols are the tangential velocity of the gas component of the simulated galaxy. The green solid line is the nonuniform circular velocity predicted from the asymmetric methodology, the violet dashed line is the uniform circular motion.
Current usage metrics show cumulative count of Article Views (full-text article views including HTML views, PDF and ePub downloads, according to the available data) and Abstracts Views on Vision4Press platform.
Data correspond to usage on the plateform after 2015. The current usage metrics is available 48-96 hours after online publication and is updated daily on week days.
Initial download of the metrics may take a while.