Fig. 8
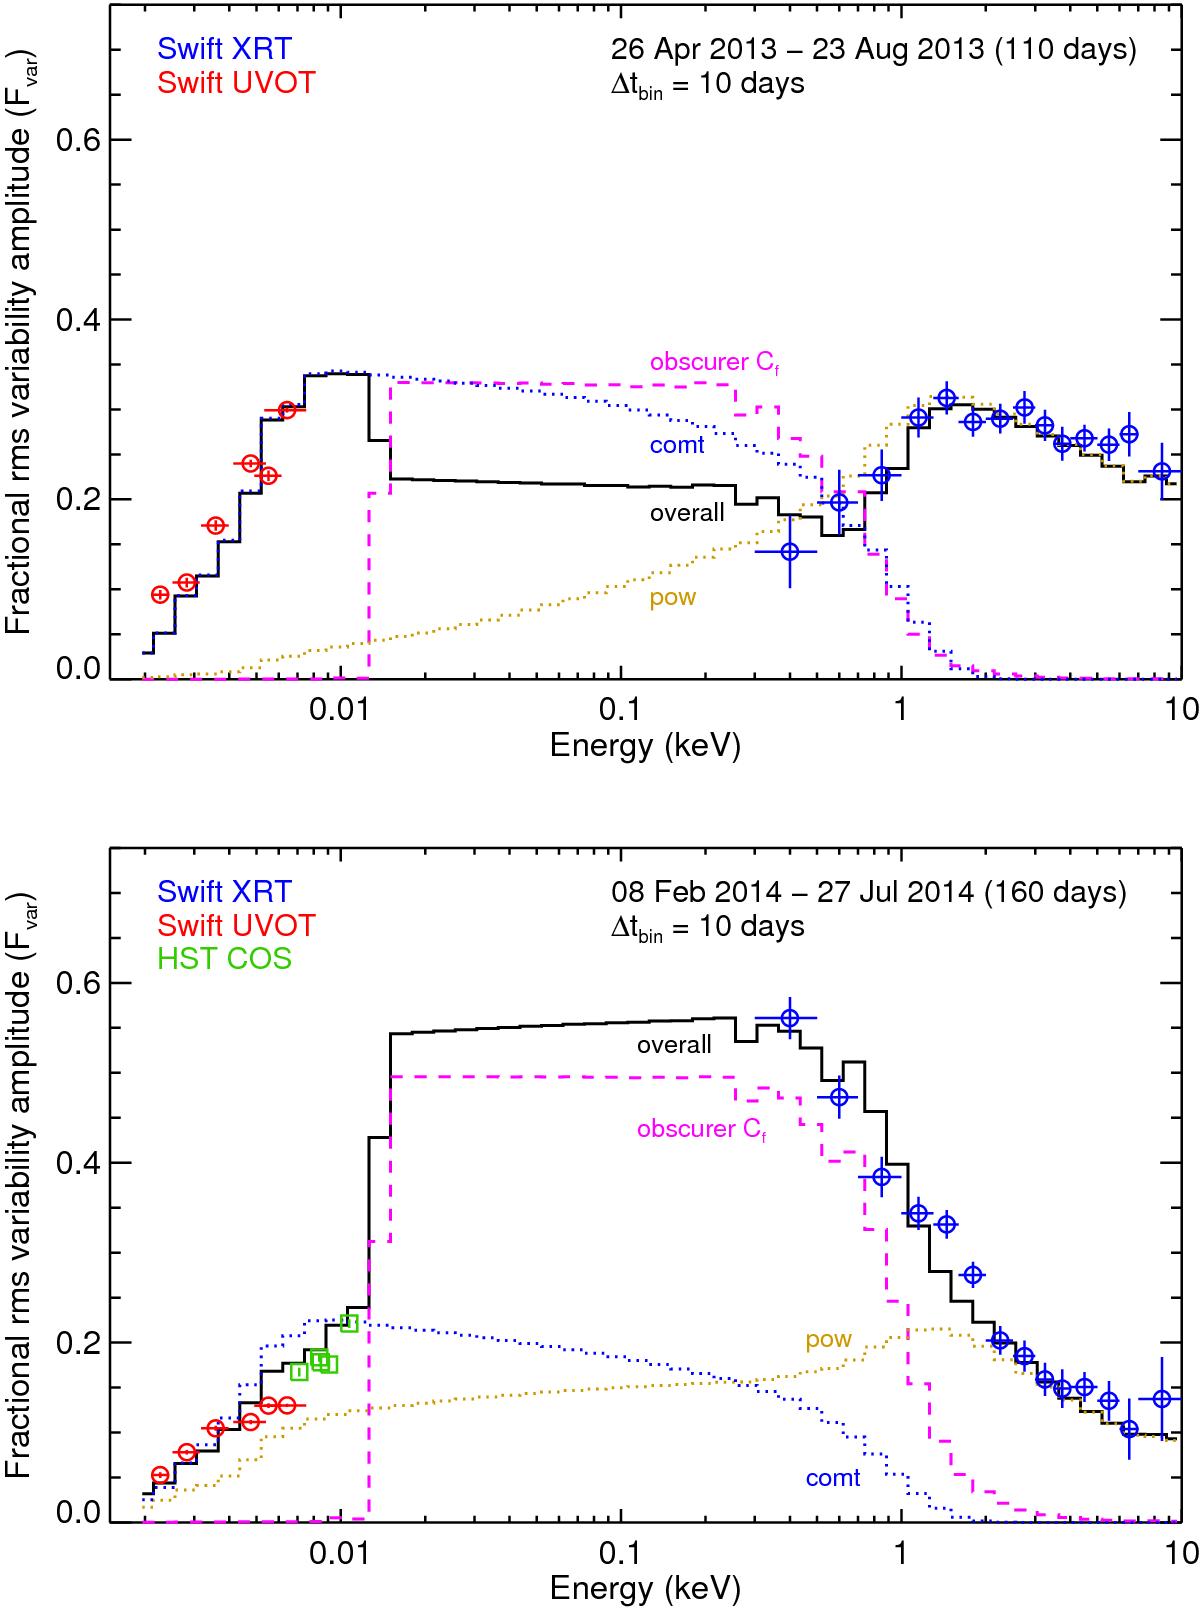
Swift and HST COS broadband rms variability spectra of NGC 5548 for selected periods in 2013 (top panel) and 2014 (bottom panel). The XRT data are shown in blue circles and the UVOT data in red circles. The HST COS data (available only for the 2014 period) are displayed in green squares in the bottom panel. The overall rms variability model generated from the variability of all the parameters derived from our spectral modelling (Sect. 3 and Fig. 4) is over-plotted in solid black line on the data. The rms variability of individual model components are also over-plotted in the panels for comparison: comt in blue dotted line, pow in brown dotted line and the obscurer Cf in dashed magenta line. The calculation of the rms spectra are described in Sect. 4. The axes ranges in both panels are identical.

Current usage metrics show cumulative count of Article Views (full-text article views including HTML views, PDF and ePub downloads, according to the available data) and Abstracts Views on Vision4Press platform.
Data correspond to usage on the plateform after 2015. The current usage metrics is available 48-96 hours after online publication and is updated daily on week days.
Initial download of the metrics may take a while.