Fig. 4
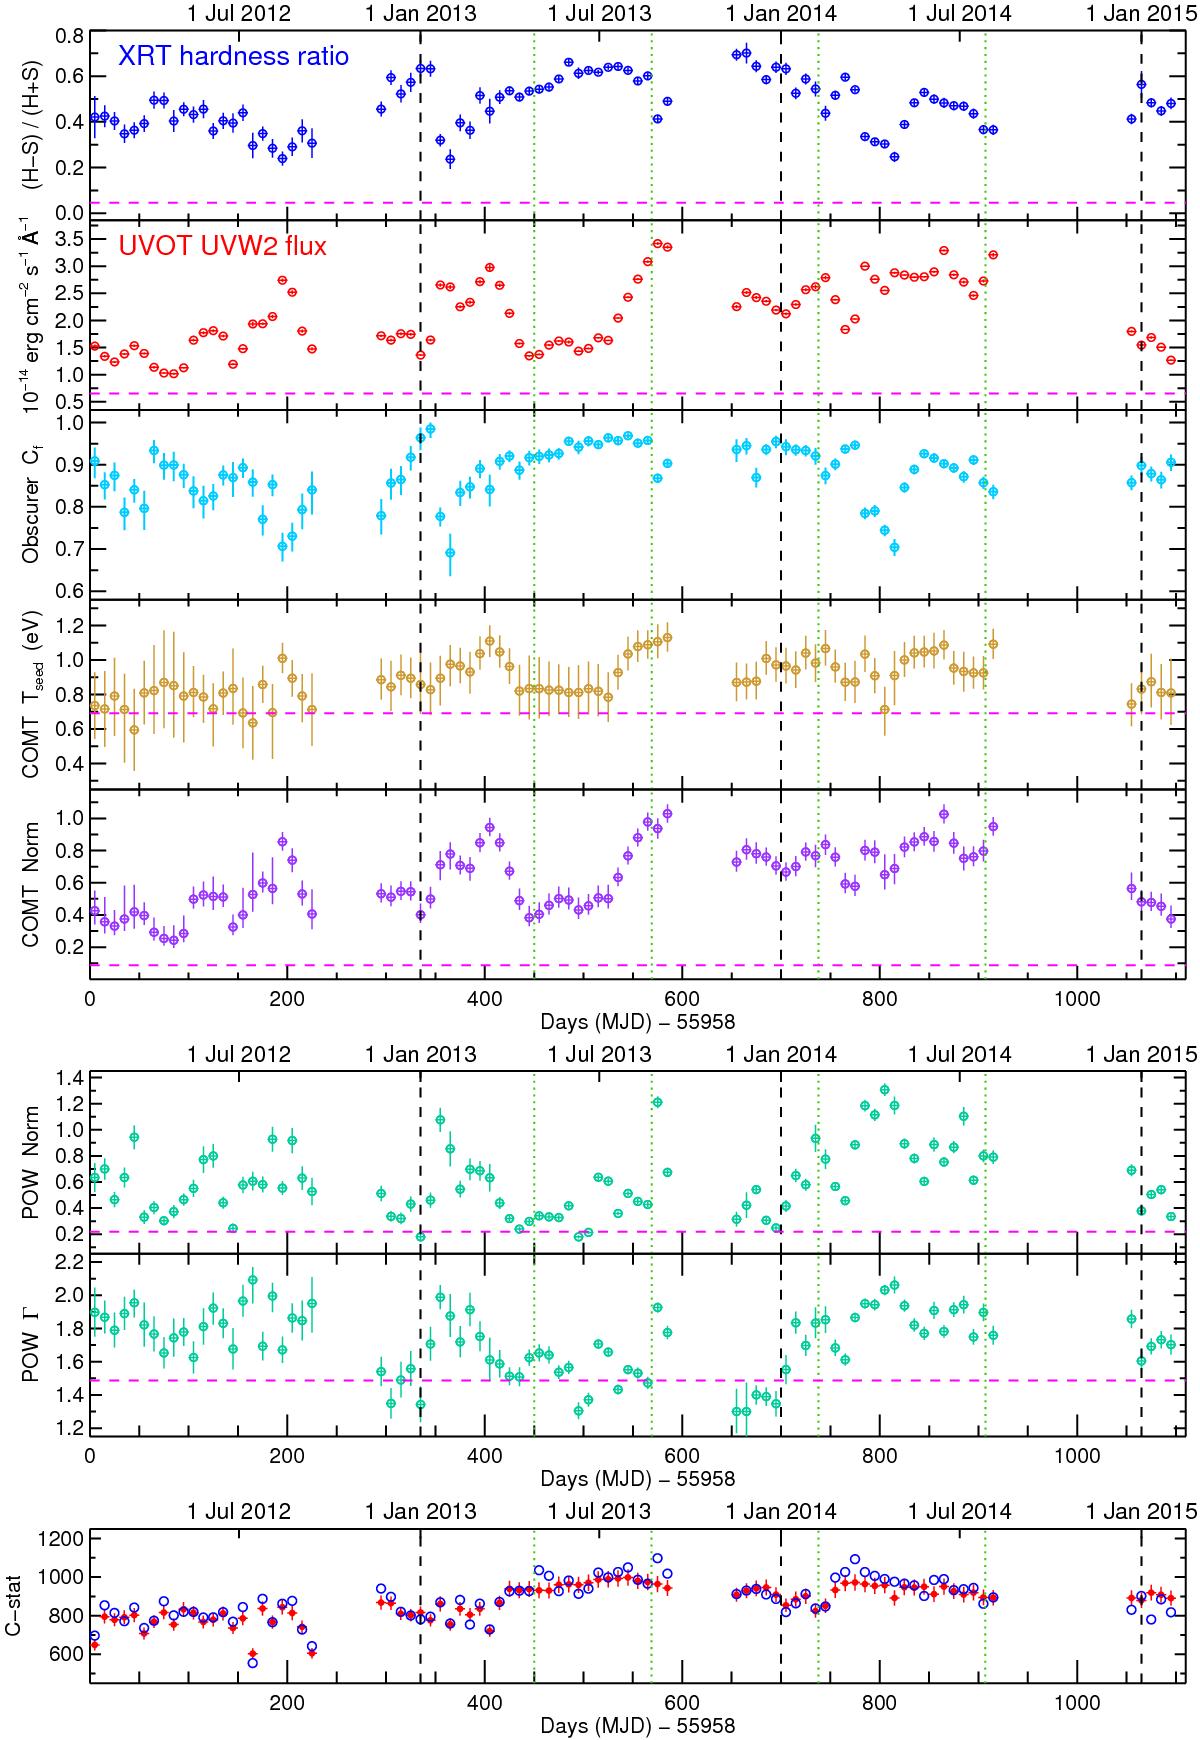
Variability of the parameters derived from broadband spectral modelling of Swift and HST COS data of NGC 5548 in Sect. 3. The X-ray hardness ratio R and the UVW2 flux are also displayed on the top two panels for comparison. On the vertical axis of each panel the name of the corresponding parameter is given. The normalisation of the warm Comptonisation (comt) component (modelling the optical/UV continuum and the soft X-ray excess) is shown in units of 1056 photons s-1 keV-1. The power-law (pow) normalisation is in 1052 photons s-1 keV-1 at 1 keV. In the bottom panel, the goodness of the fits are shown, with blue open circles indicating the obtained C-stat and the filled red circles indicating the expected C-stat with its rms uncertainties. The range of the above time-series is from 1 February 2012 to 4 February 2015. The vertical dotted lines in green indicate two interesting periods in 2013 and 2014, which were selected for the temporal variability analysis of Sect. 4 and production of rms spectra in Fig. 8. The vertical dashed lines in black indicate the start of each year for reference. The horizontal dashed lines in magenta represent the averages from previous years (2005 and 2007 Swift data from the unobscured epoch) derived in this work with the same model.
Current usage metrics show cumulative count of Article Views (full-text article views including HTML views, PDF and ePub downloads, according to the available data) and Abstracts Views on Vision4Press platform.
Data correspond to usage on the plateform after 2015. The current usage metrics is available 48-96 hours after online publication and is updated daily on week days.
Initial download of the metrics may take a while.