Fig. 2
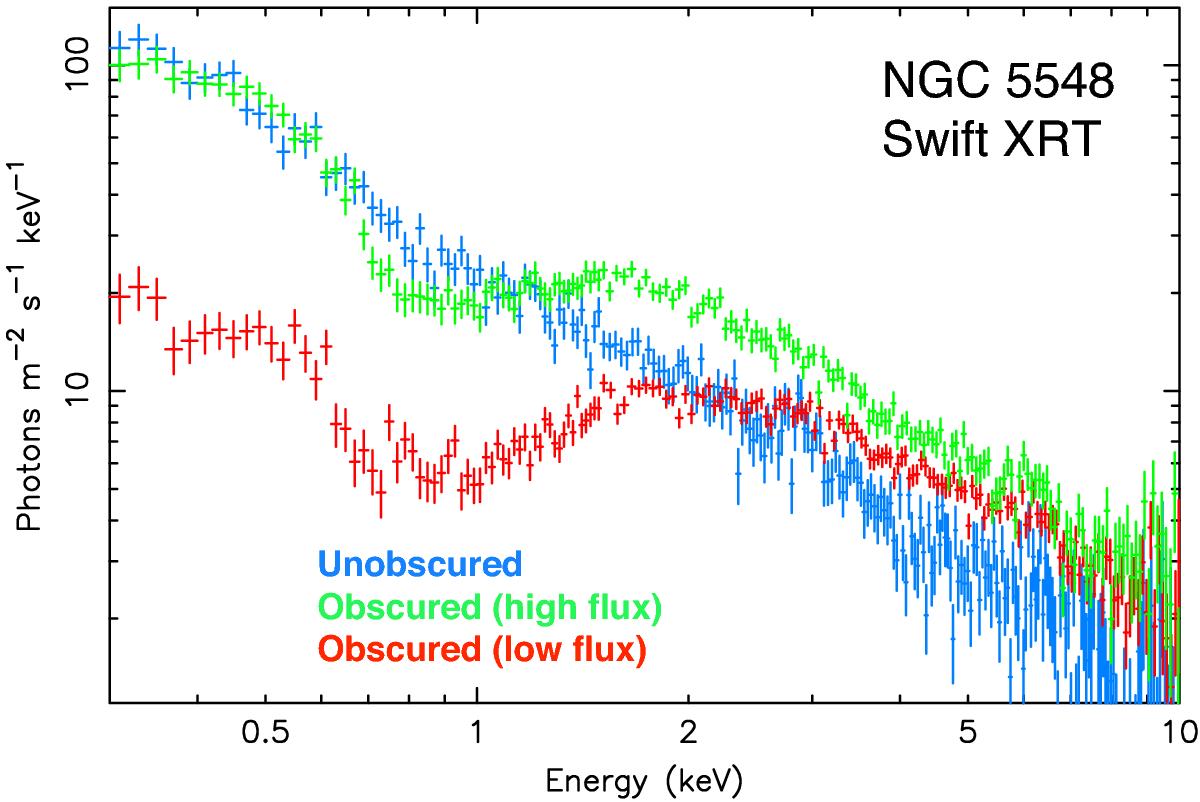
Examples of NGC 5548 Swift XRT spectra taken at different epochs. The unobscured spectrum (shown in blue) corresponds to the archival 2005 and 2007 data. The low-flux obscured spectrum (shown in red) is produced from observations taken between 22 June and 1 August 2013 (56 465−56 505 in MJD). The high-flux obscured spectrum (shown in green) corresponds to observations taken between 20 March and 29 April 2014 (56 736−56 776 in MJD). The visible spectral changes are indicative of variability induced by both the obscurer and the underlying continuum emission.
Current usage metrics show cumulative count of Article Views (full-text article views including HTML views, PDF and ePub downloads, according to the available data) and Abstracts Views on Vision4Press platform.
Data correspond to usage on the plateform after 2015. The current usage metrics is available 48-96 hours after online publication and is updated daily on week days.
Initial download of the metrics may take a while.