Fig. 1
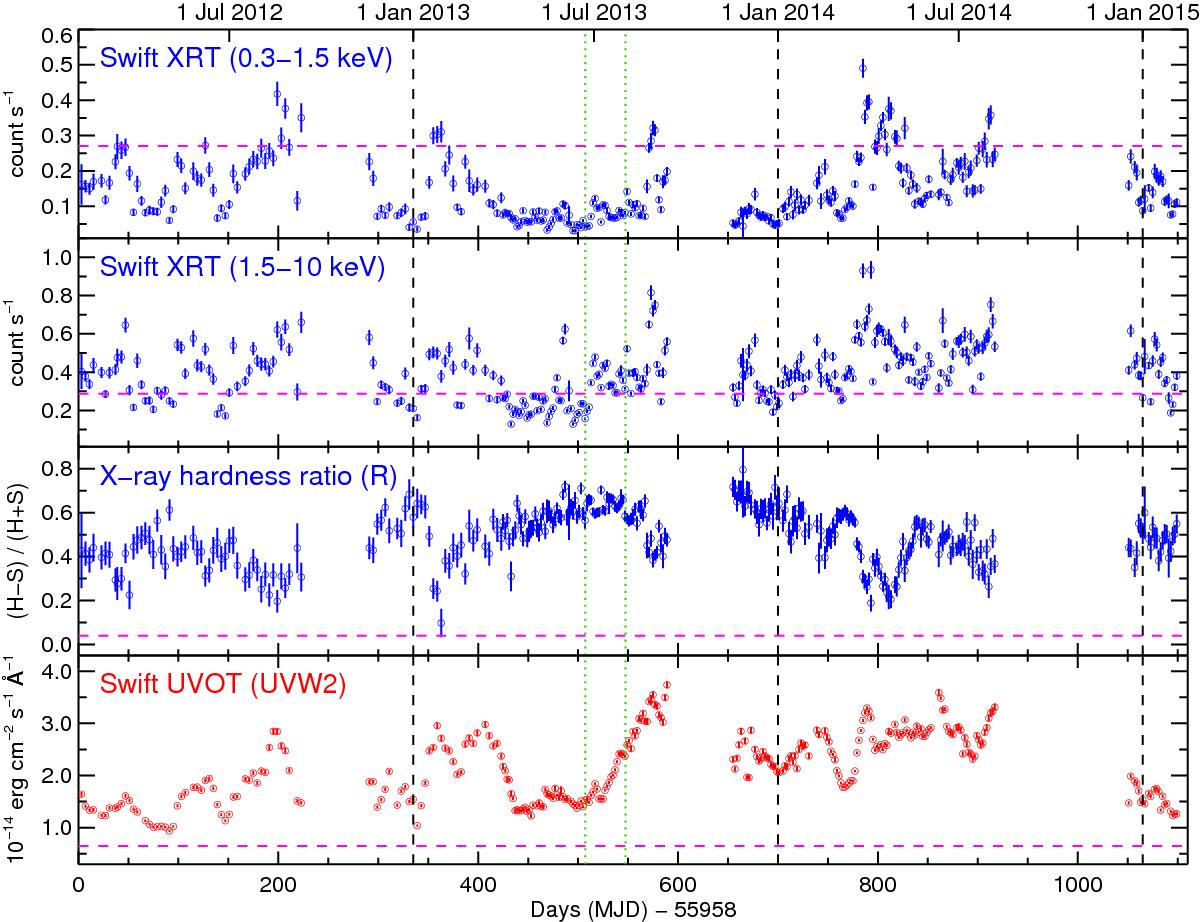
Swift lightcurves of NGC 5548 from 1 February 2012 to 4 February 2015, during which the X-ray source is obscured. The data are displayed with bin sizes of two days for clarity of presentation. The vertical dotted lines in green indicate the interval of our summer 2013 XMM-Newton campaign. The vertical dashed lines in black indicate the start of each year for reference. The horizontal dashed lines in magenta represent the averages from Swift observations in 2005 and 2007, when the X-ray source was unobscured. The panels are described in Sect. 2.1.
Current usage metrics show cumulative count of Article Views (full-text article views including HTML views, PDF and ePub downloads, according to the available data) and Abstracts Views on Vision4Press platform.
Data correspond to usage on the plateform after 2015. The current usage metrics is available 48-96 hours after online publication and is updated daily on week days.
Initial download of the metrics may take a while.