Fig. 1
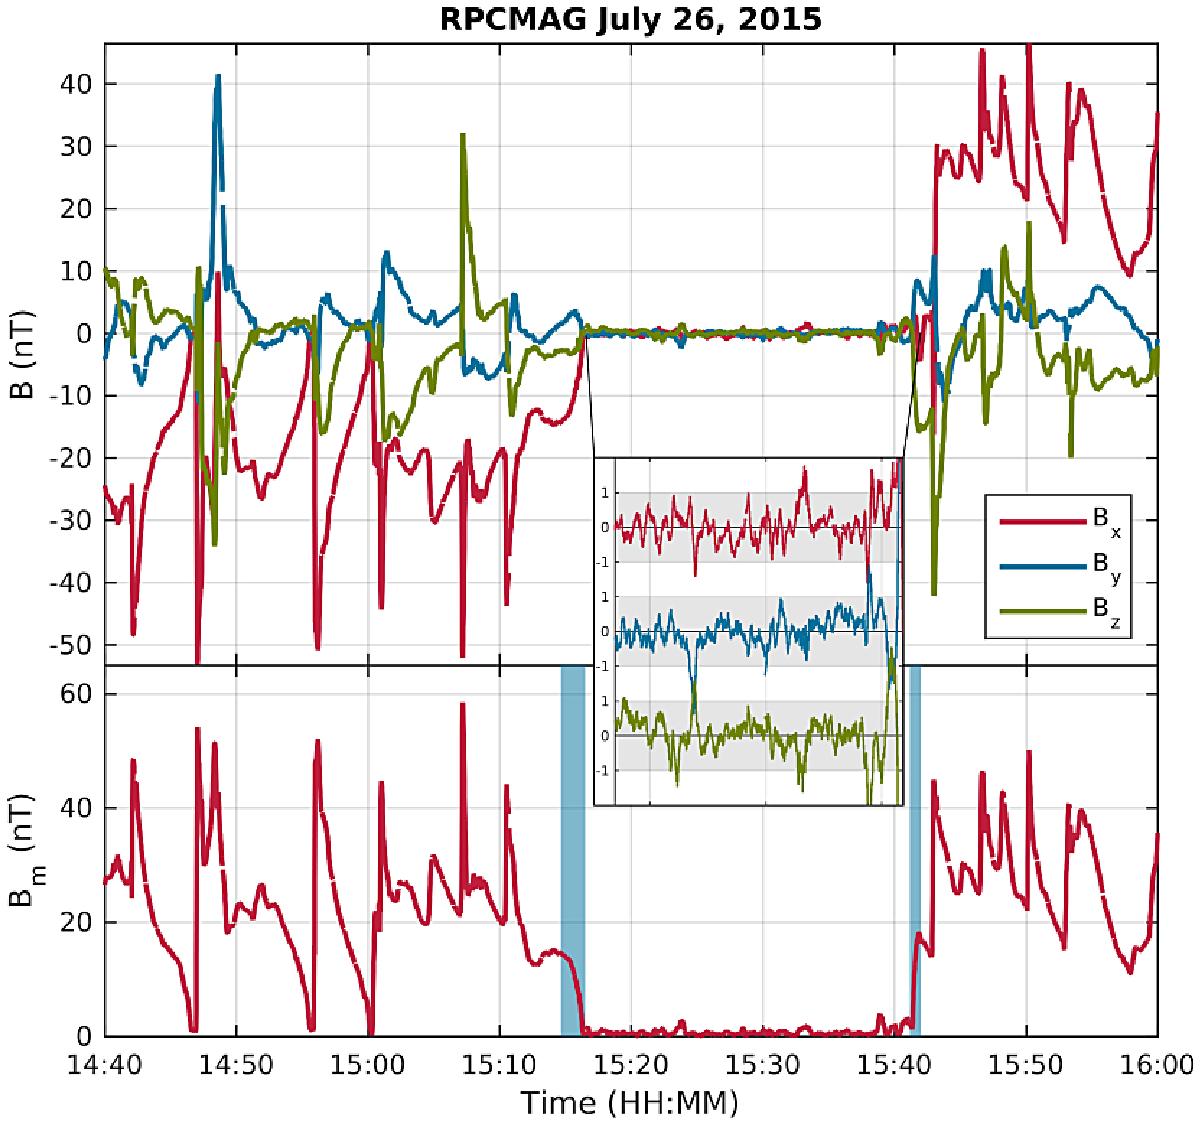
Magnetic field data on July 26, 2015 from 14:40:00 UT to 16:00:00 UT. The top panel shows the three vector components, which have been corrected by subtracting a constant offset determined by the remaining magnetic field data in the cavity. The magnetic field magnitude shown in the bottom panel has been calculated from the corrected data. The cavity is visible between 15:16:00 UT and 15:41:00 UT, and the shaded areas mark the transition regions. The inset shows a more detailed picture of the three magnetic field components in the diamagnetic cavity.
Current usage metrics show cumulative count of Article Views (full-text article views including HTML views, PDF and ePub downloads, according to the available data) and Abstracts Views on Vision4Press platform.
Data correspond to usage on the plateform after 2015. The current usage metrics is available 48-96 hours after online publication and is updated daily on week days.
Initial download of the metrics may take a while.