Free Access
Fig. 2
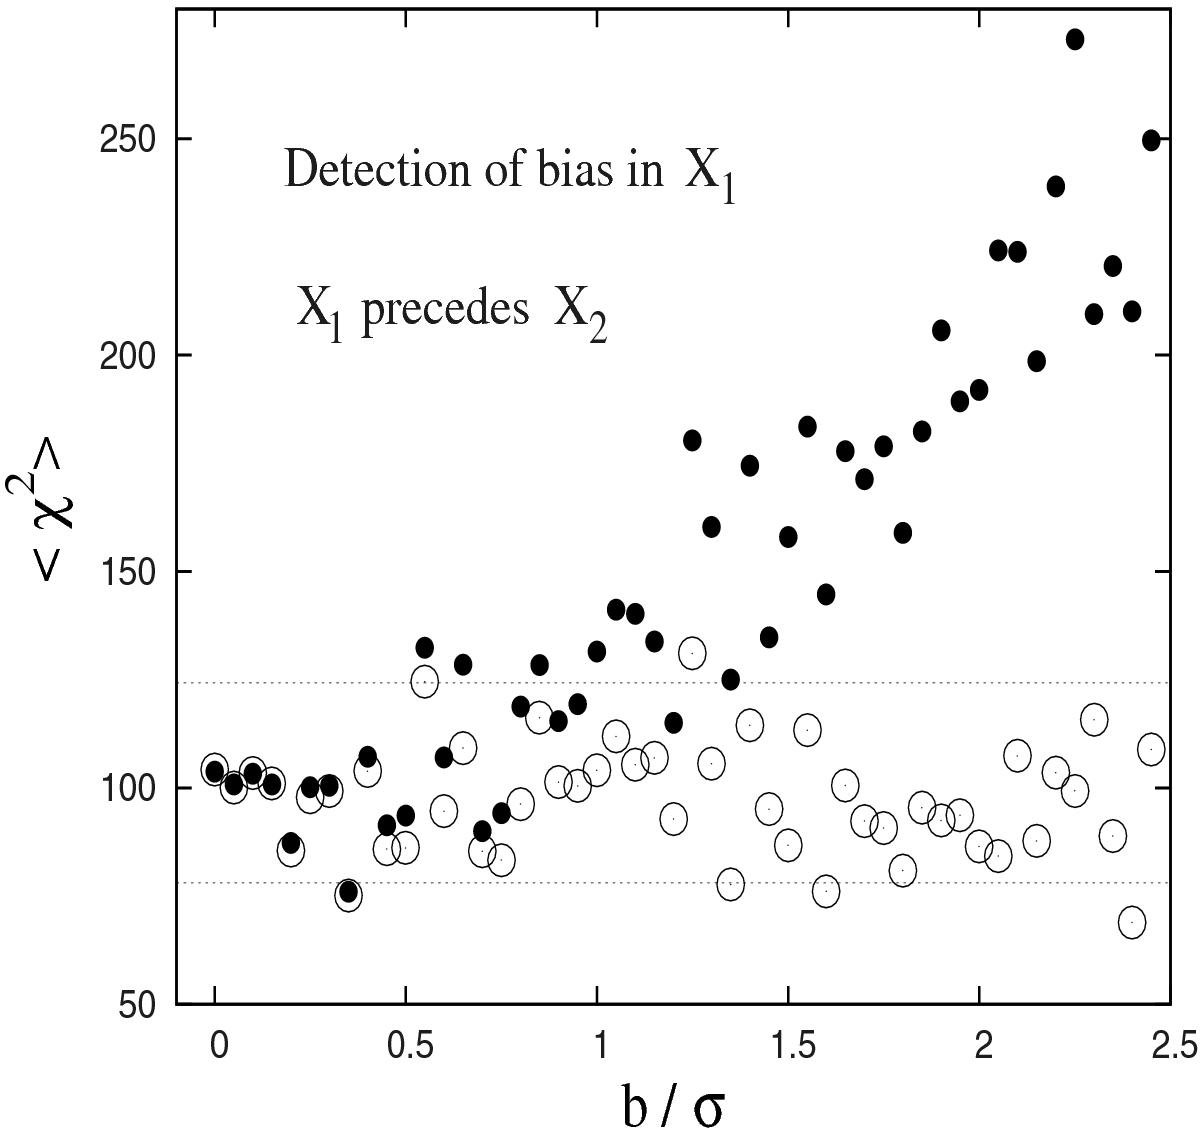
Detection of bias in X1 with the ⟨ χ2 ⟩ π statistic when X2 is analysed with prior derived from X1. Values of ⟨ χ2 ⟩ π (filled circles) and ⟨ χ2 ⟩ u (open circles) are plotted against the bias parameter b/σ. The dashed lines are the 5 and 95% levels.
Current usage metrics show cumulative count of Article Views (full-text article views including HTML views, PDF and ePub downloads, according to the available data) and Abstracts Views on Vision4Press platform.
Data correspond to usage on the plateform after 2015. The current usage metrics is available 48-96 hours after online publication and is updated daily on week days.
Initial download of the metrics may take a while.