Fig. 4
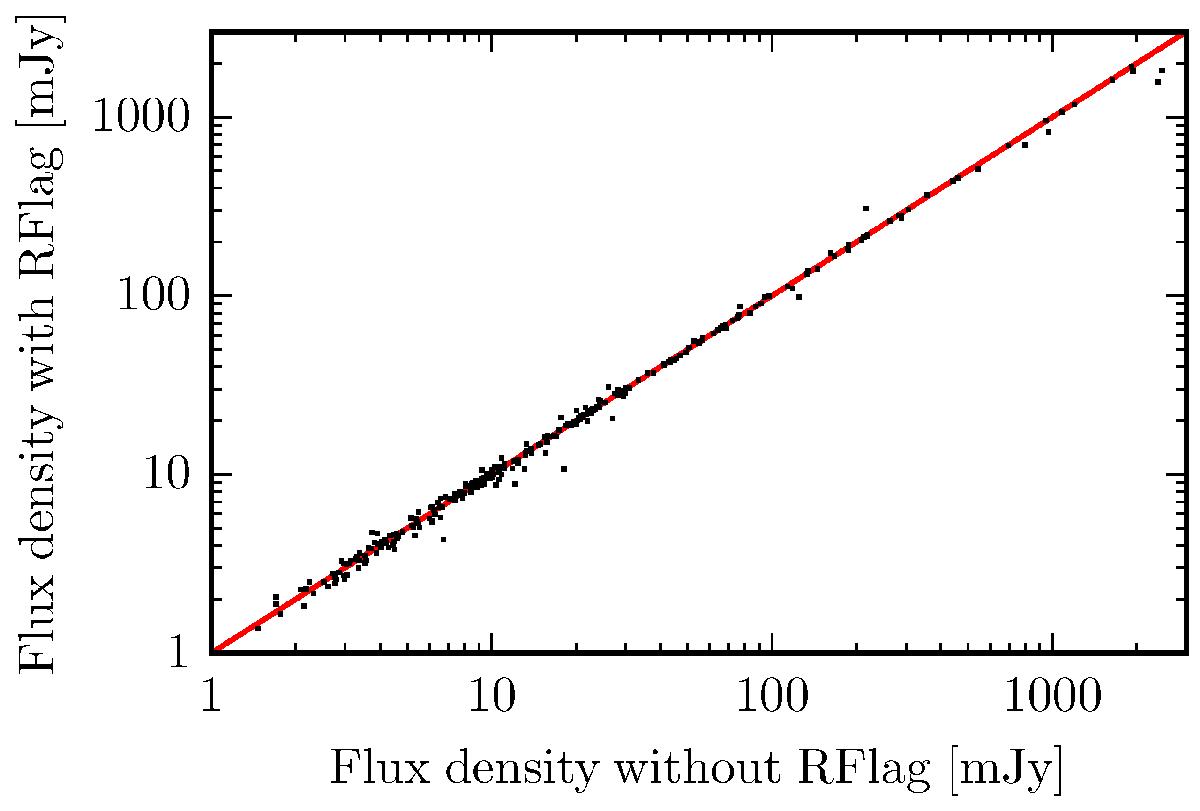
Extracted flux density of sources with the RFlag method applied as a function of the extracted flux density for the same sources without the RFlag method applied. For this comparison we used the spectral window around 1.4 GHz and the field around l = 22°. The red line represents a one-to-one relation. Over a wide range of flux densities, the RFlag method does not influence the actual source flux densities.
Current usage metrics show cumulative count of Article Views (full-text article views including HTML views, PDF and ePub downloads, according to the available data) and Abstracts Views on Vision4Press platform.
Data correspond to usage on the plateform after 2015. The current usage metrics is available 48-96 hours after online publication and is updated daily on week days.
Initial download of the metrics may take a while.