Fig. A.2
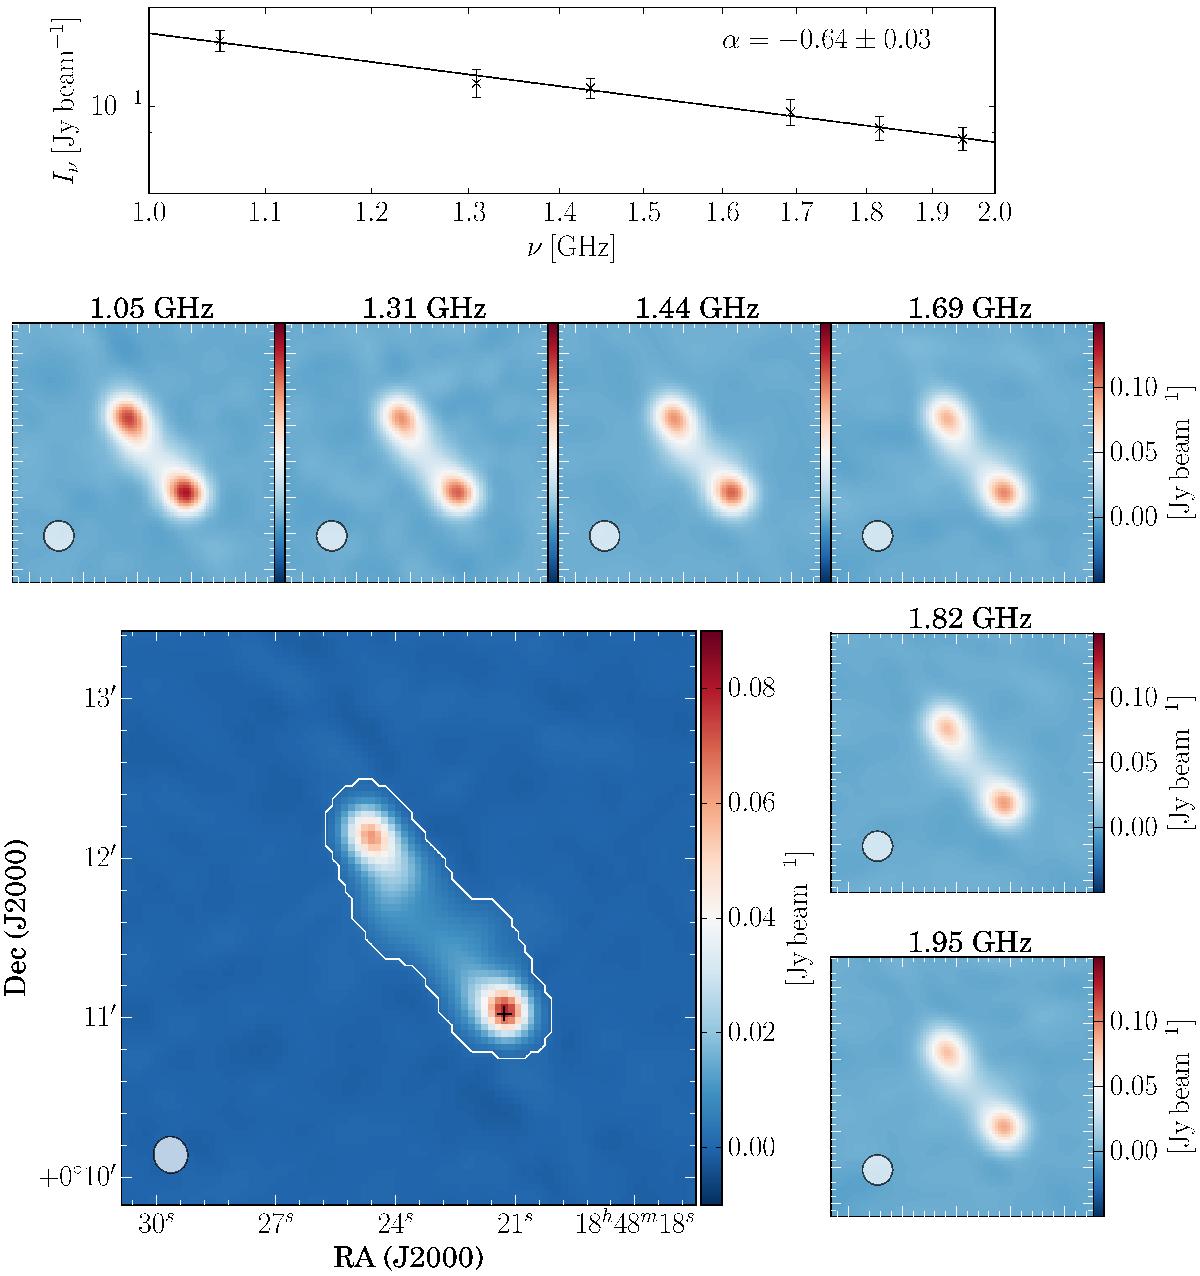
Example image of the THOR source G32.744+0.770, which is most likely an extragalactic jet. The large image represents an averaged image of the two spectral windows around 1.4 and 1.8 GHz, which we used for the source extraction (see Sects. 3.1 and 3.3). The white contours shows the extent of the source determined by the BLOBCAT algorithm. The black cross marks the peak position, which we used to determine the spectral index. The small images show each spectral window separately, and the top panel presents the peak intensity for each spectral window and the corresponding spectral index fit. In each image the synthesized beam is given in the lower left corner.
Current usage metrics show cumulative count of Article Views (full-text article views including HTML views, PDF and ePub downloads, according to the available data) and Abstracts Views on Vision4Press platform.
Data correspond to usage on the plateform after 2015. The current usage metrics is available 48-96 hours after online publication and is updated daily on week days.
Initial download of the metrics may take a while.