Fig. 23
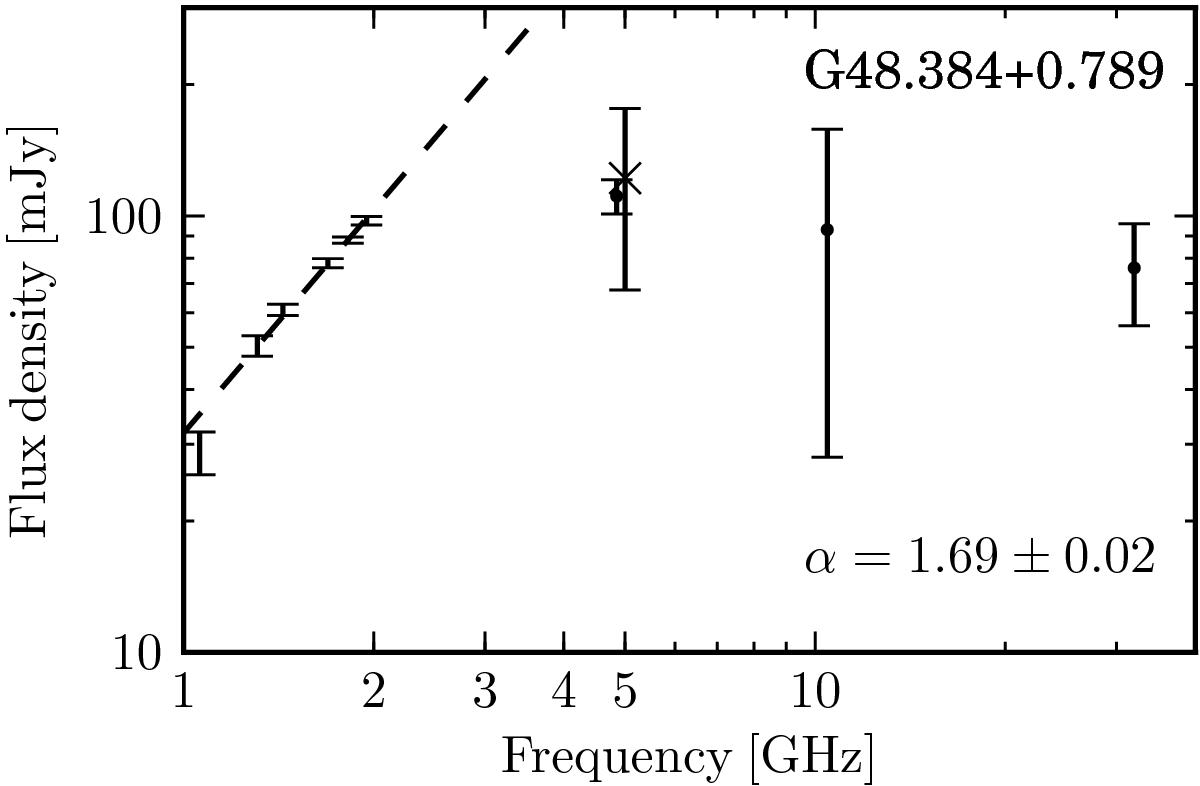
Spectrum of the THOR source G48.384+0.789. The data points between 1 and 2 GHz are taken from the THOR survey, and the dashed line represents the fitted spectral index to these data points of α = 1.69 ± 0.02. The data point at 5 GHz (x-shape) is taken from the CORNISH survey (Purcell et al. 2013), and the data points at 4.85, 10.45, and 32 GHz (circles) are taken from Vollmer et al. (2008). For each data point, a 5σ uncertainty is shown.
Current usage metrics show cumulative count of Article Views (full-text article views including HTML views, PDF and ePub downloads, according to the available data) and Abstracts Views on Vision4Press platform.
Data correspond to usage on the plateform after 2015. The current usage metrics is available 48-96 hours after online publication and is updated daily on week days.
Initial download of the metrics may take a while.