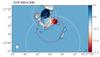
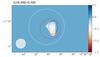
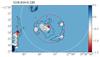
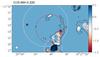
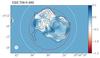
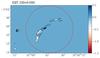
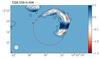
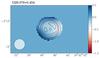
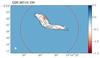
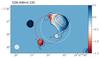
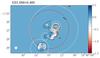
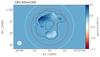
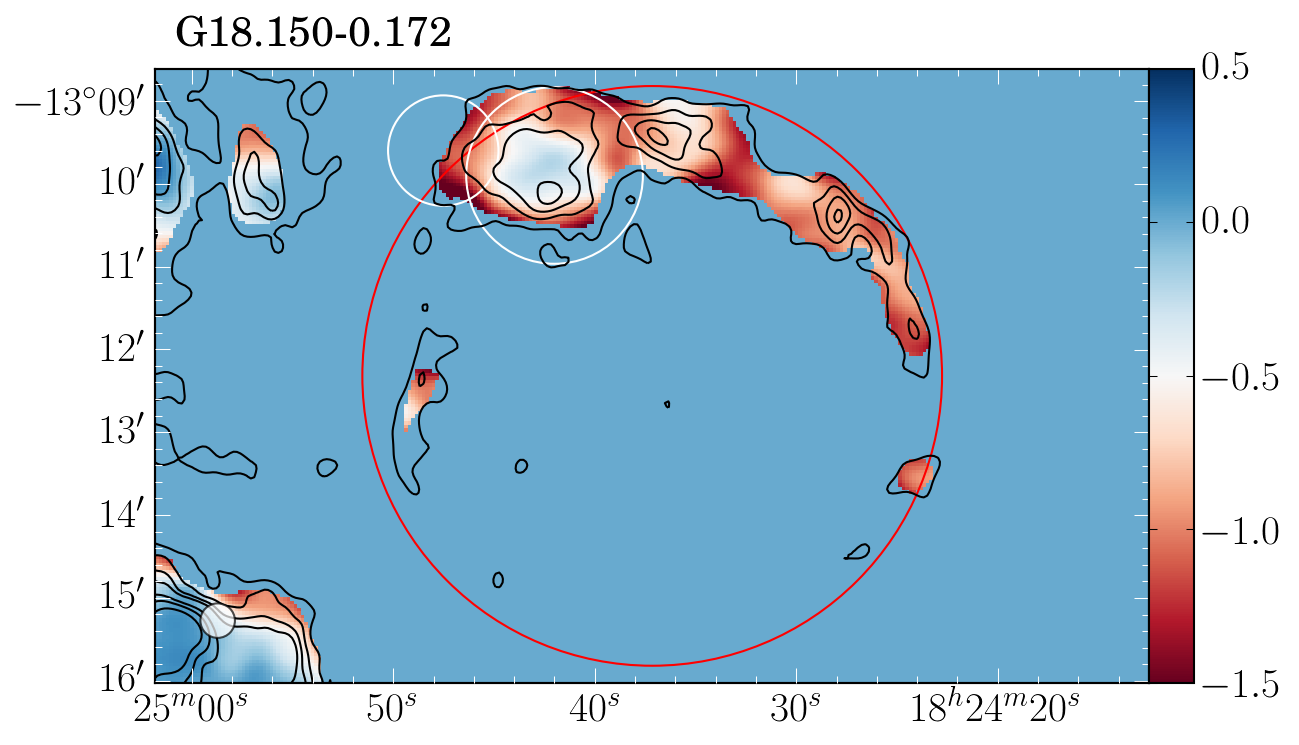
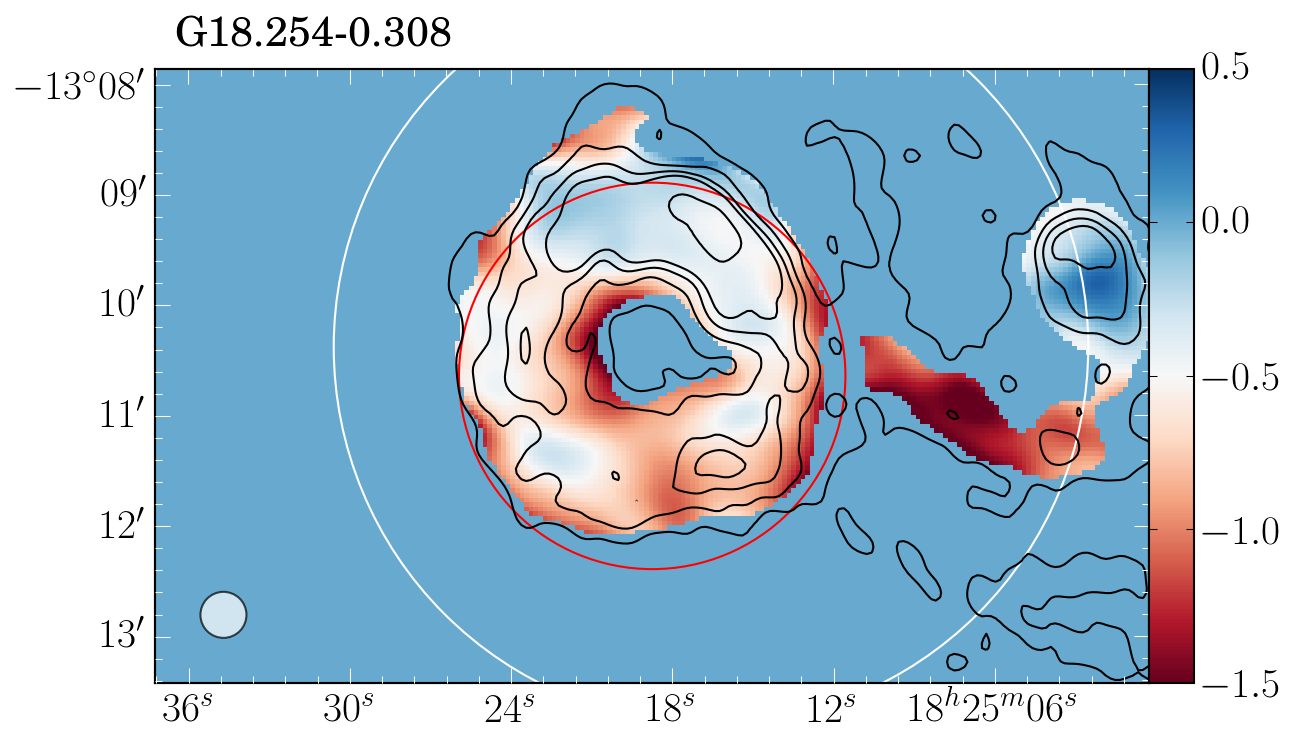
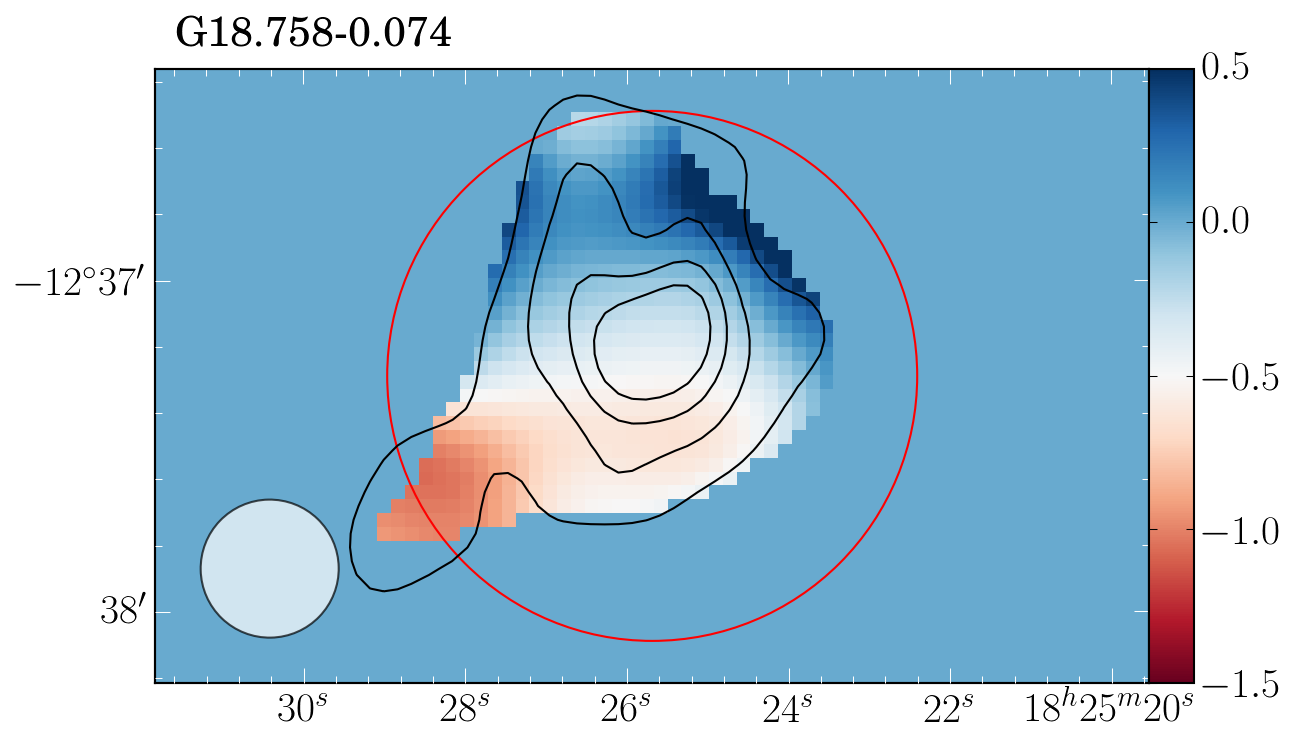
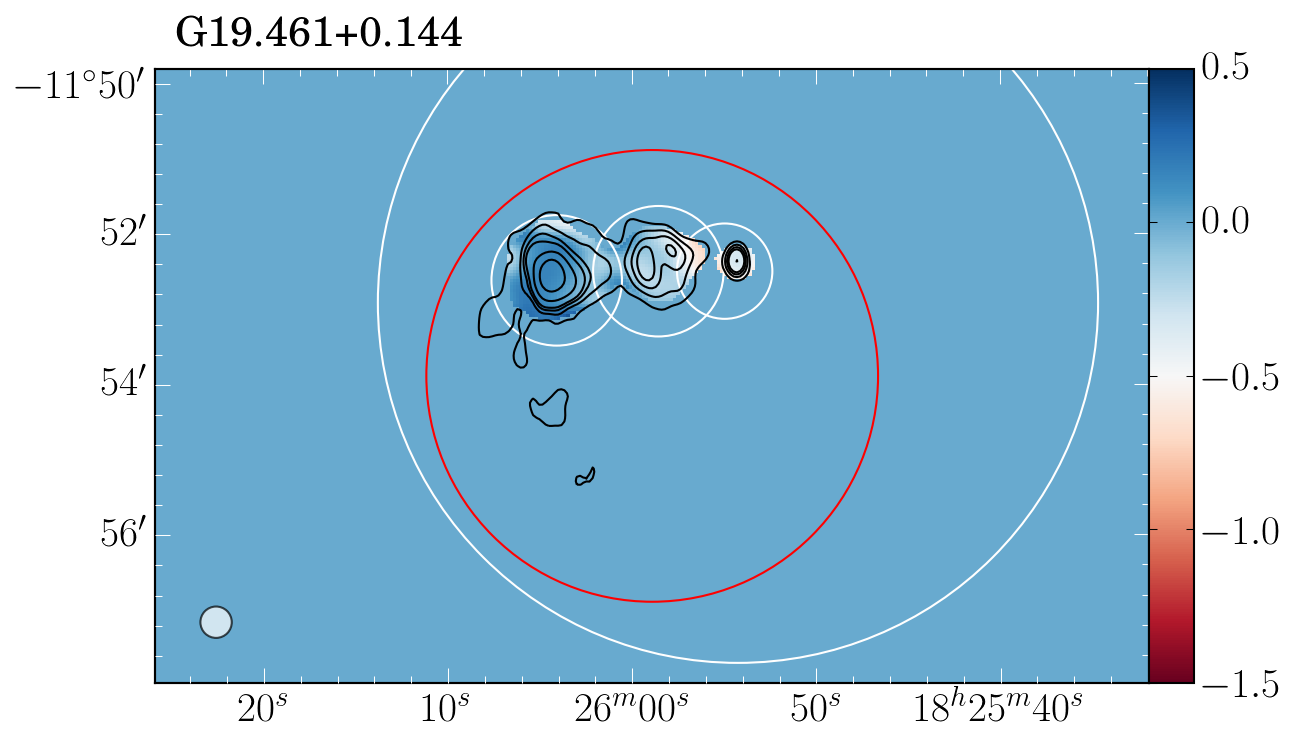
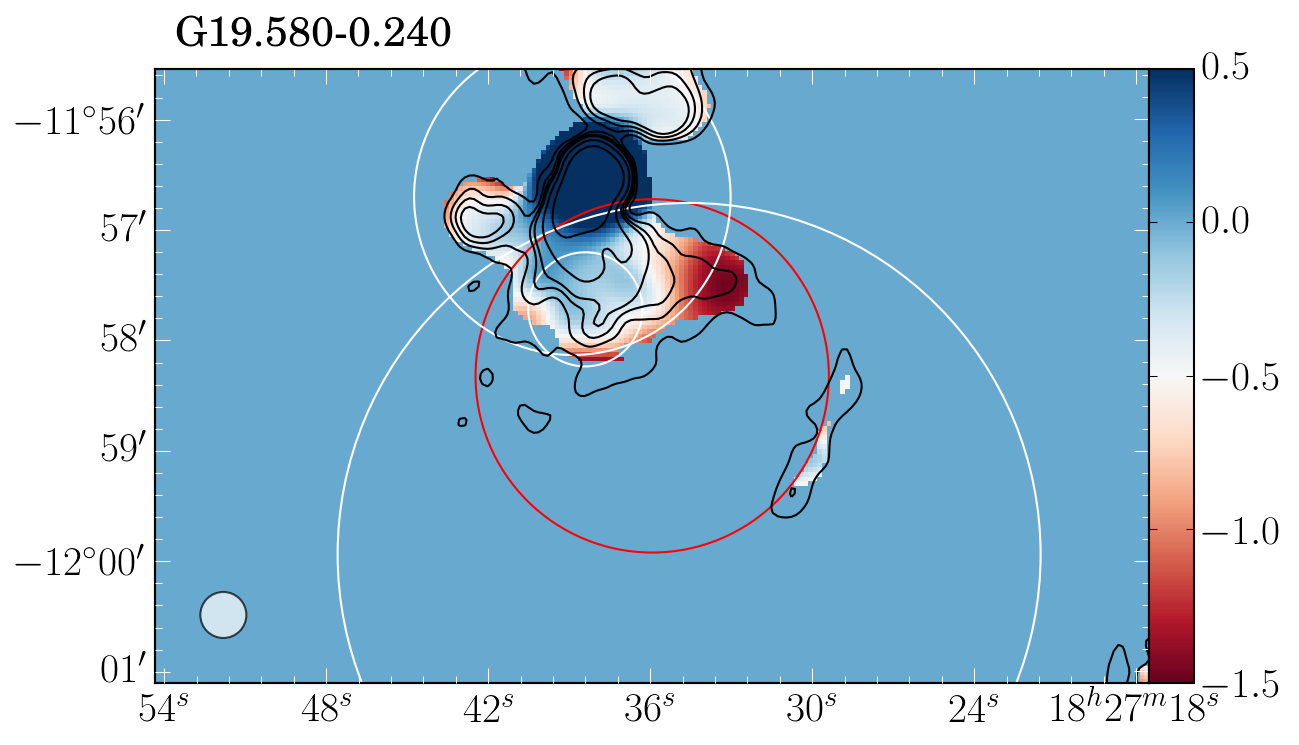
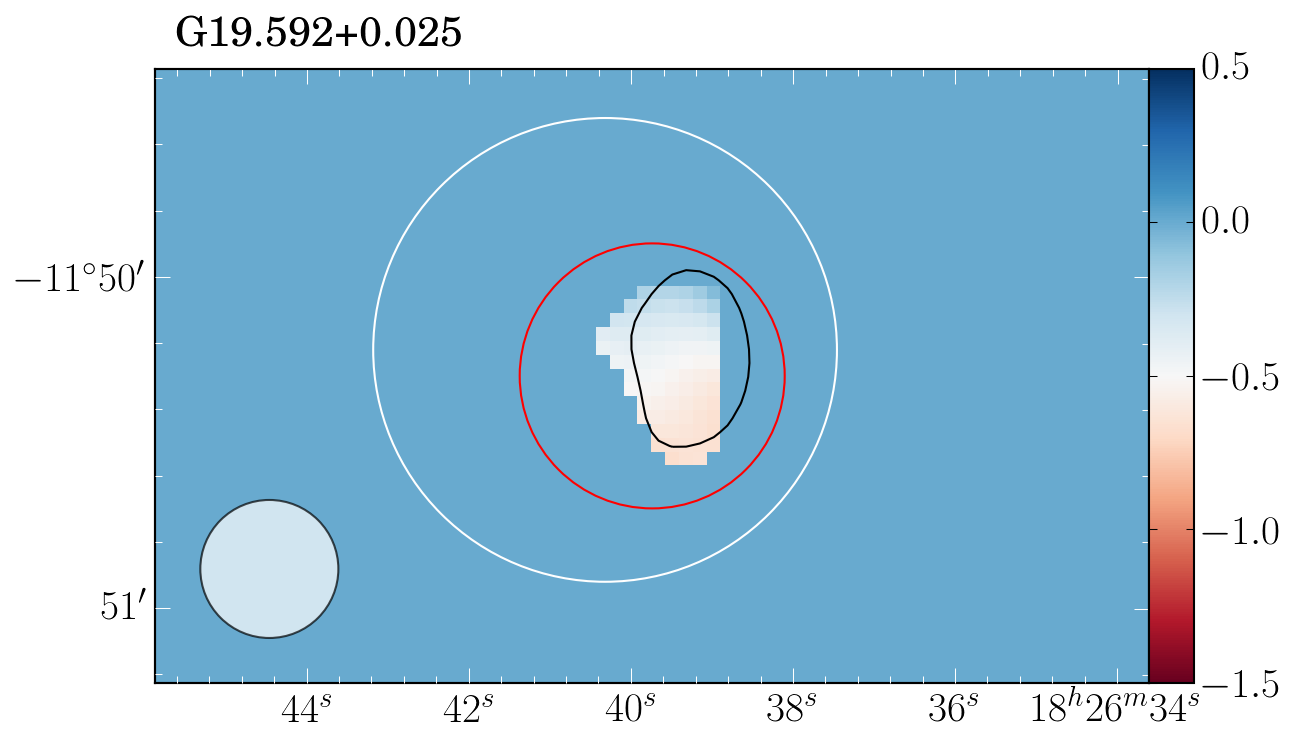
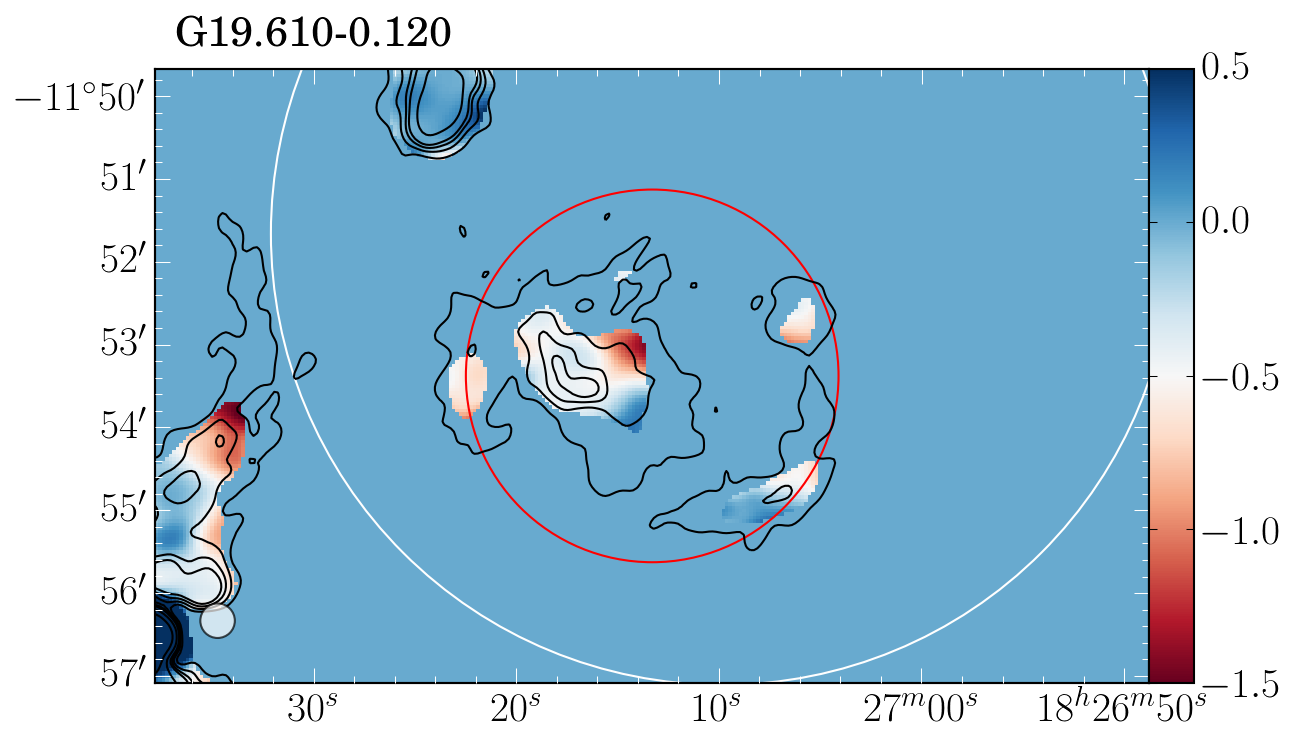
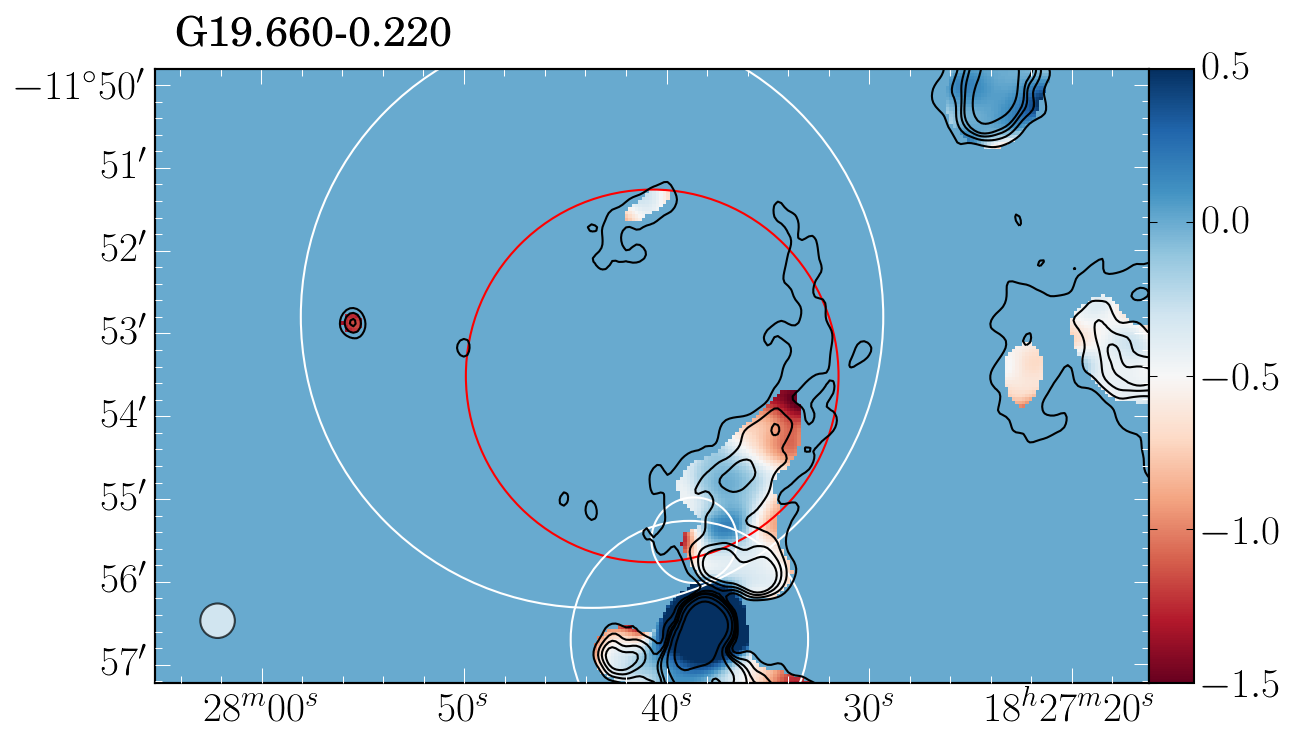
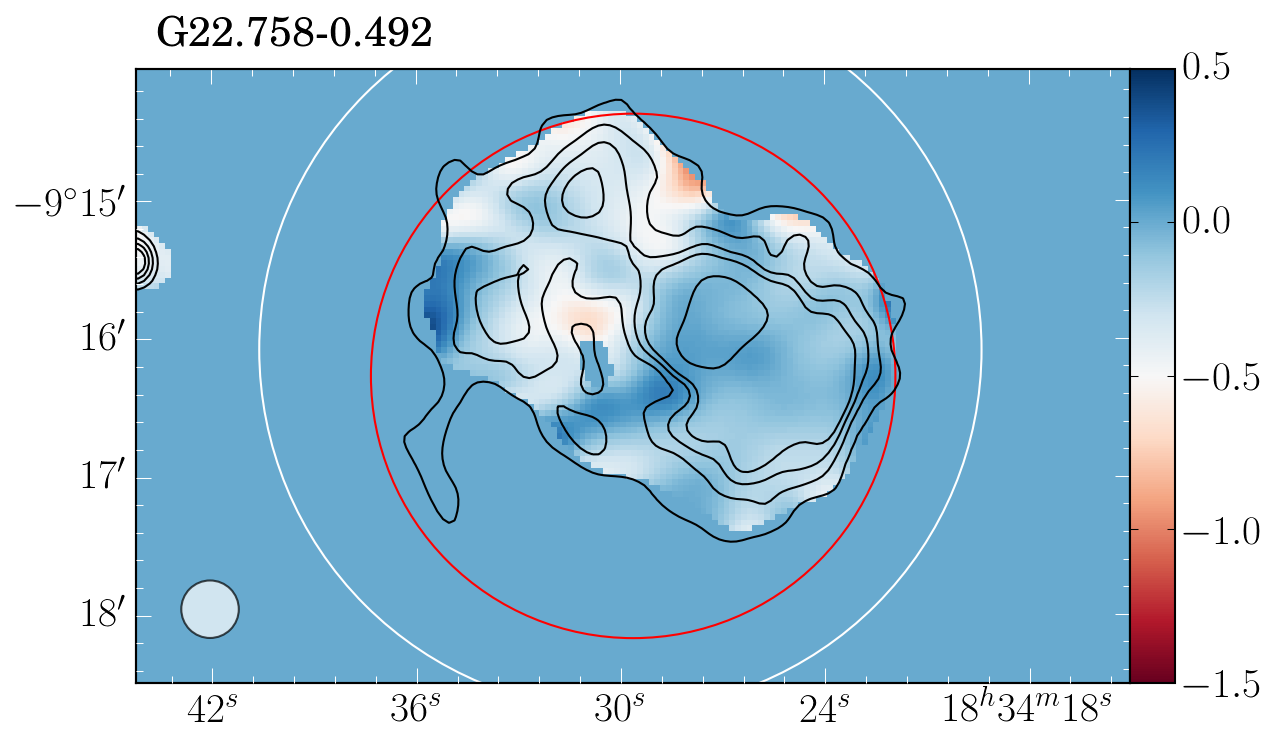
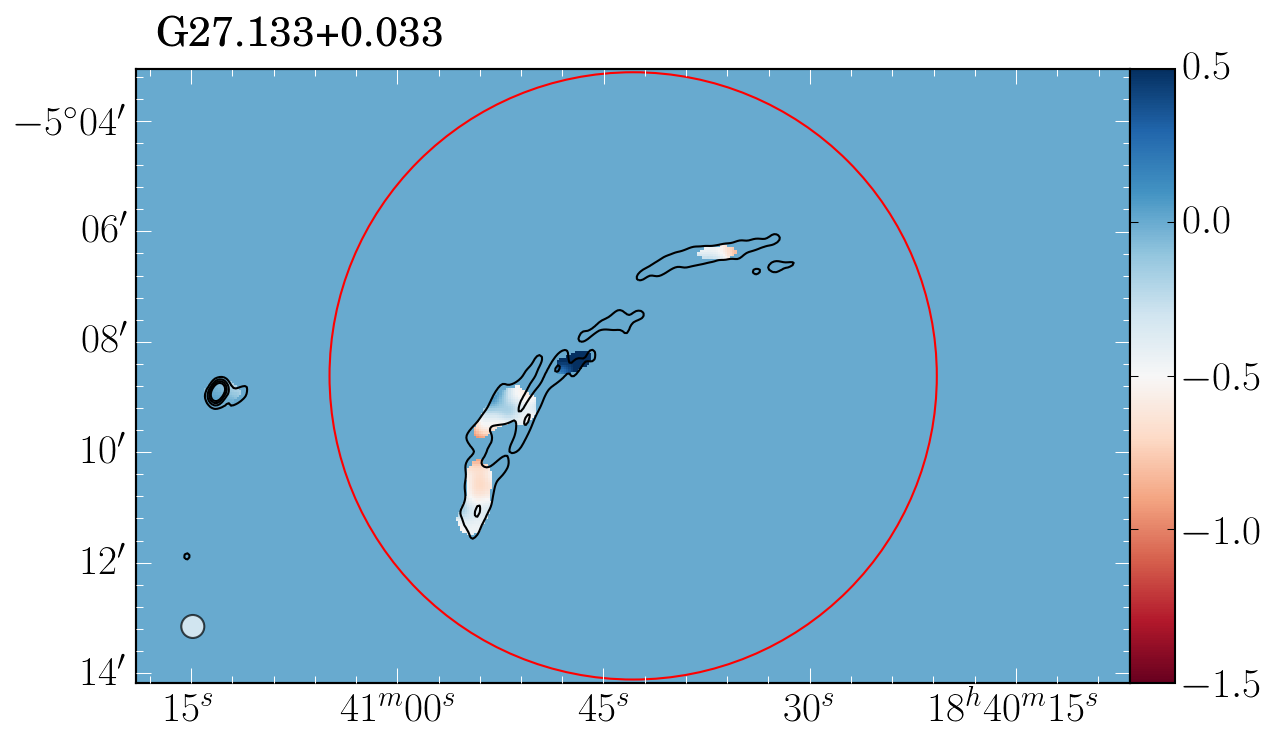
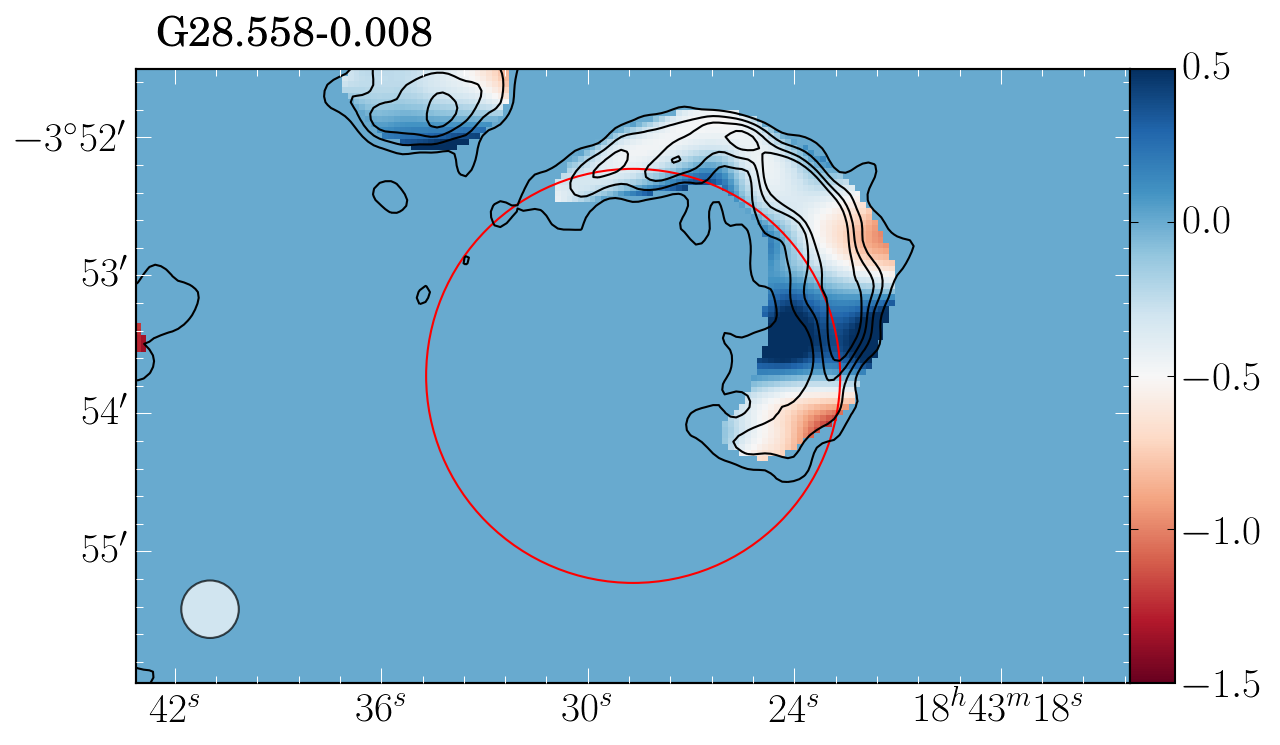
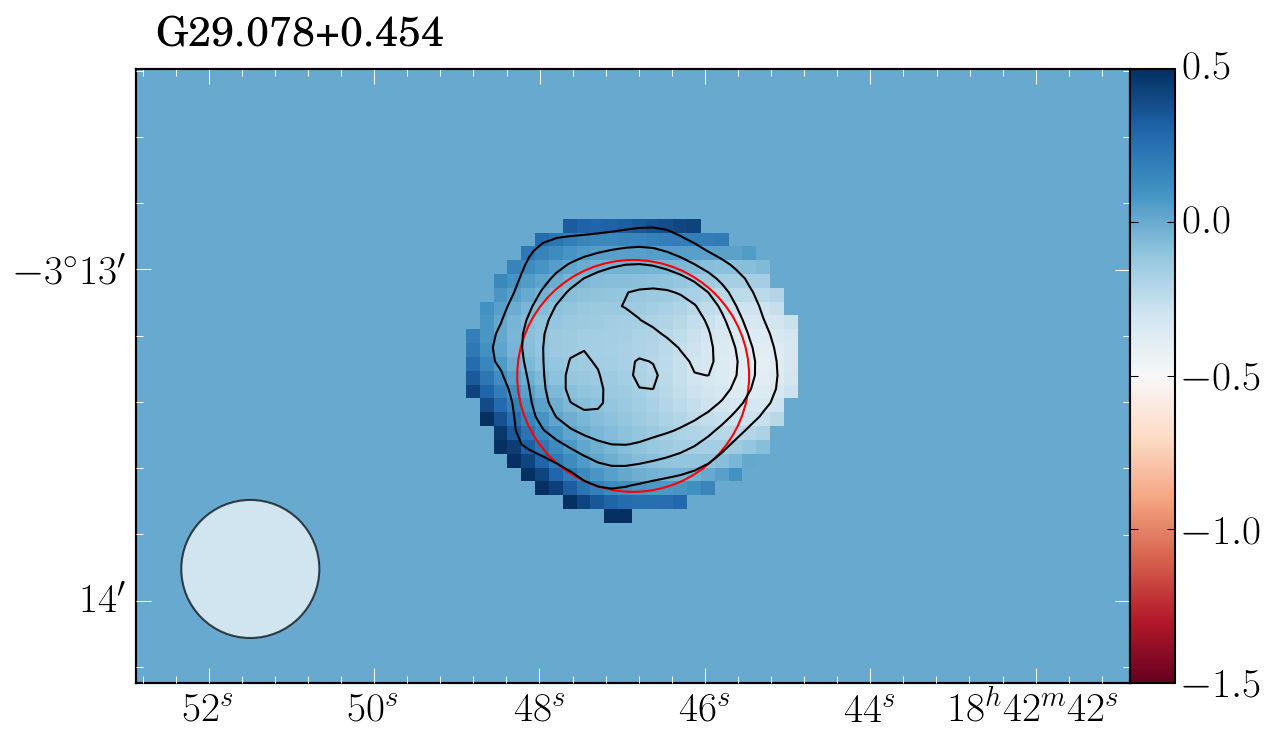
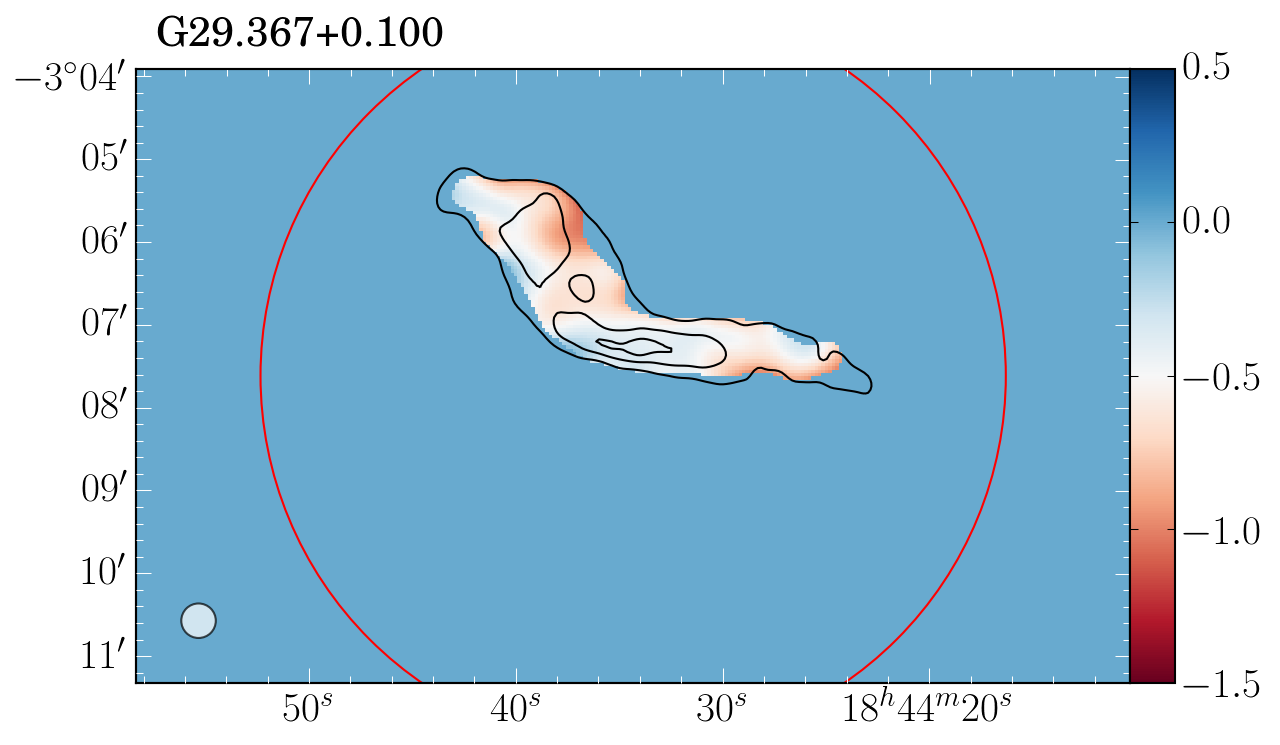
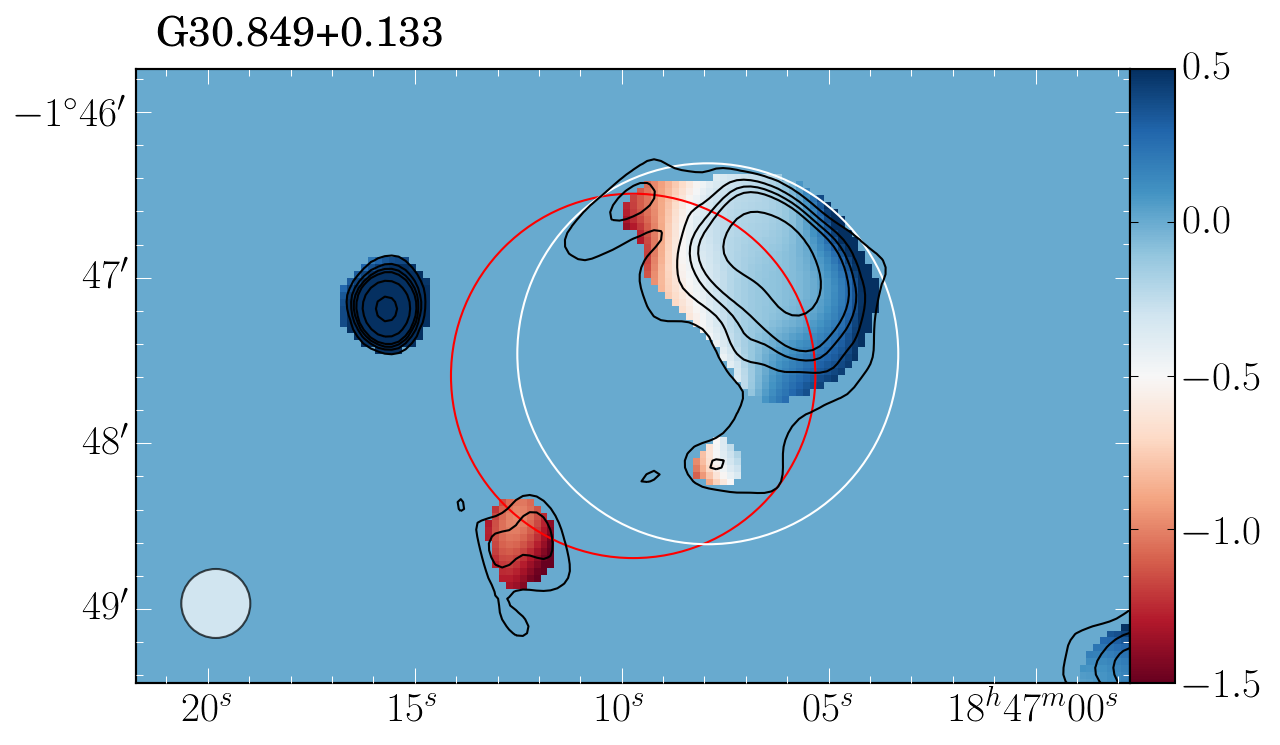
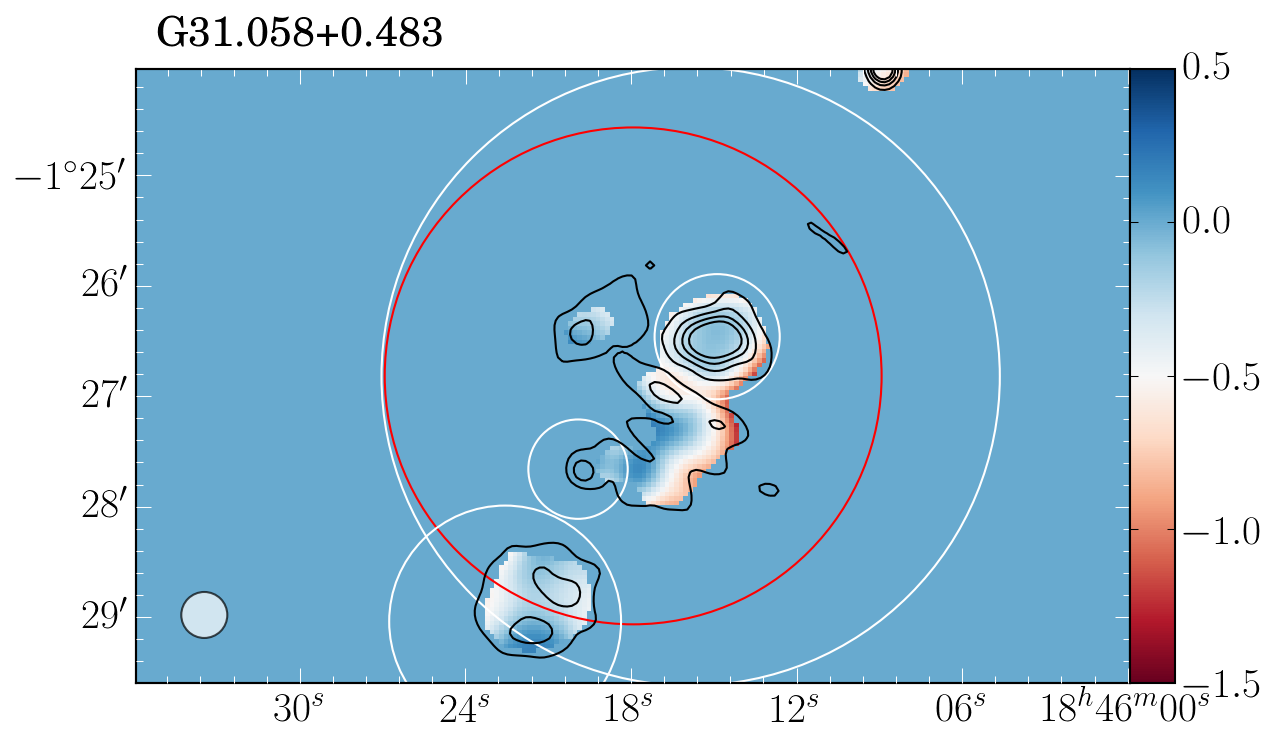
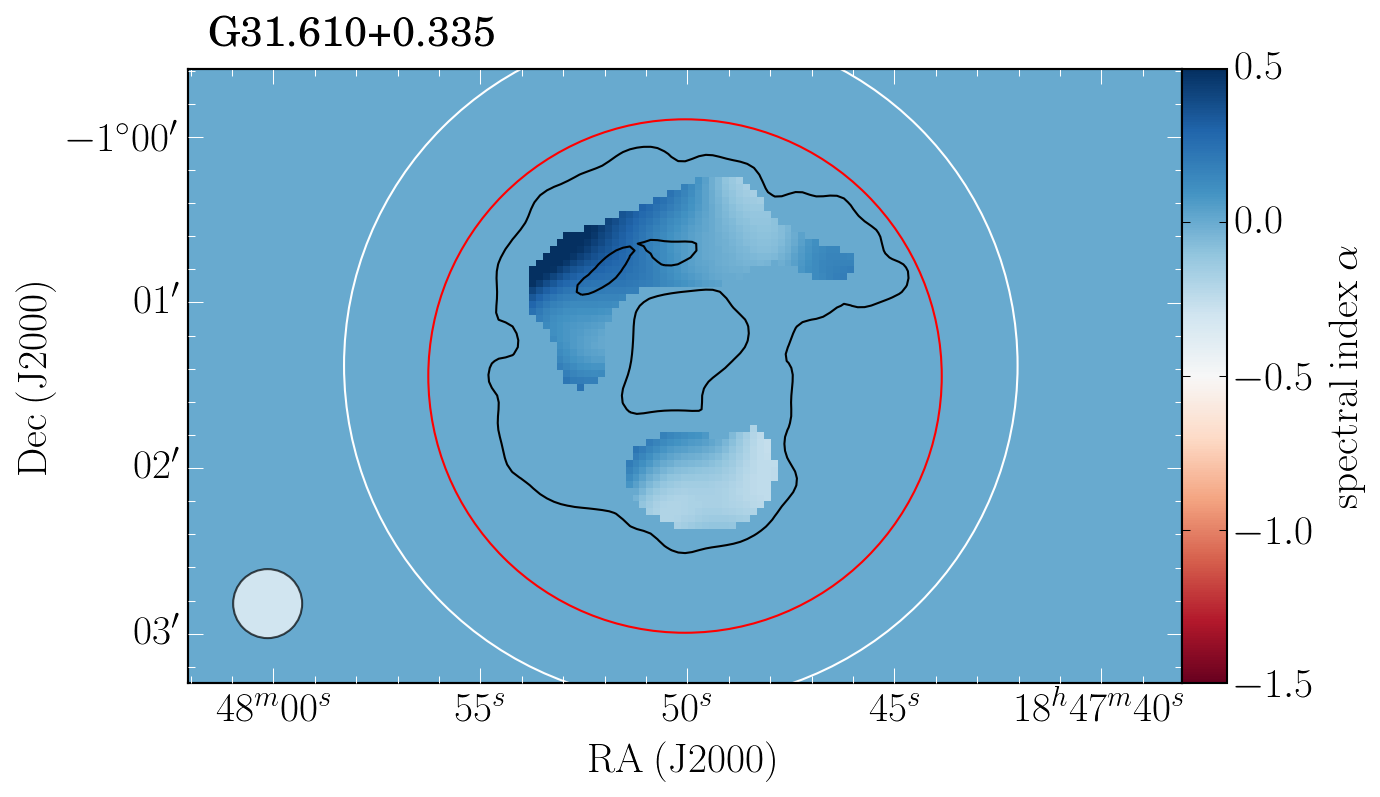
Fig. 22
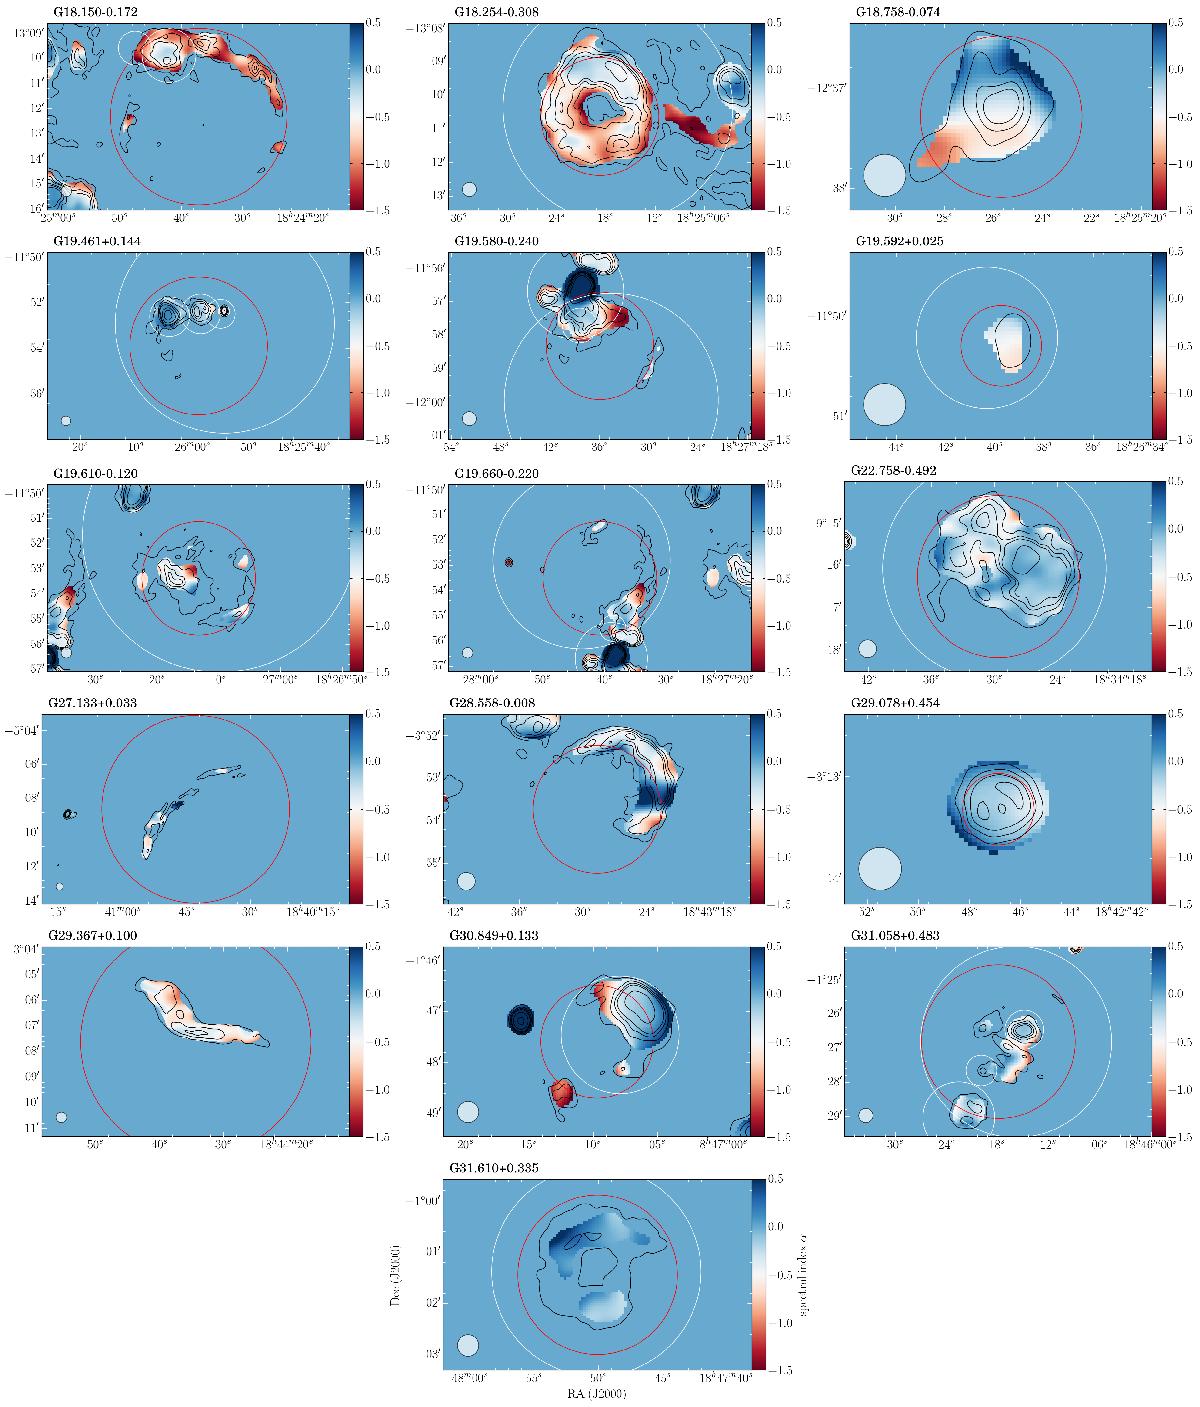
Spectral index maps of extended MAGPIS SNR candidates. The color scale represents the spectral index α from −1.5 to 0.5, the black contours show the continuum emission in steps of 5, 10, 15, 20, 40, and 100 mJy beam-1. The red and white circles indicate the sizes of the SNR candidates given in Helfand et al. (2006) and the sizes of the H ii regions given in Anderson et al. (2014), respectively. In each panel the synthesized beam is shown in the bottom left corner.

Current usage metrics show cumulative count of Article Views (full-text article views including HTML views, PDF and ePub downloads, according to the available data) and Abstracts Views on Vision4Press platform.
Data correspond to usage on the plateform after 2015. The current usage metrics is available 48-96 hours after online publication and is updated daily on week days.
Initial download of the metrics may take a while.