Free Access
Fig. 15
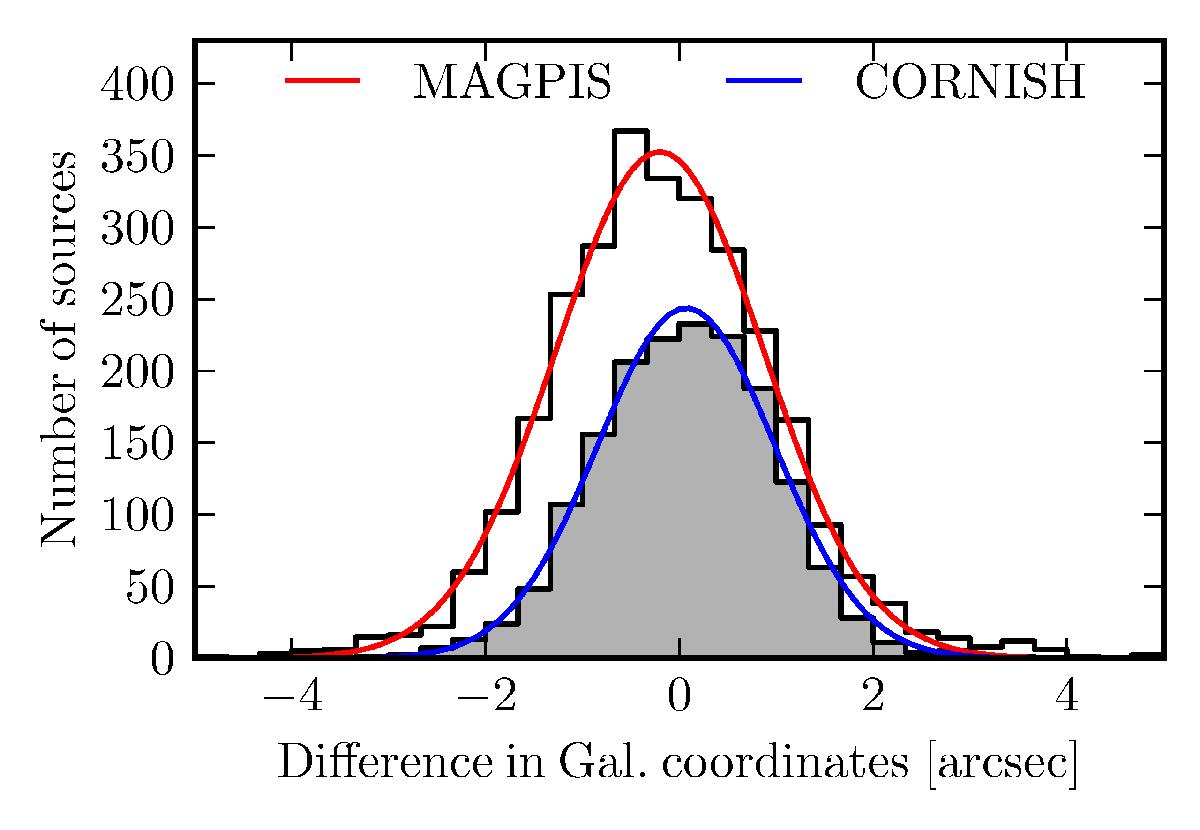
Histogram for the number of sources as a function of the difference in Galactic coordinates of the peak position for the matched sources with the MAGPIS and CORNISH catalogs in red and blue, respectively. The black histogram represents the actual data, whereas the colored lines show the corresponding fits.
Current usage metrics show cumulative count of Article Views (full-text article views including HTML views, PDF and ePub downloads, according to the available data) and Abstracts Views on Vision4Press platform.
Data correspond to usage on the plateform after 2015. The current usage metrics is available 48-96 hours after online publication and is updated daily on week days.
Initial download of the metrics may take a while.