Fig. 12
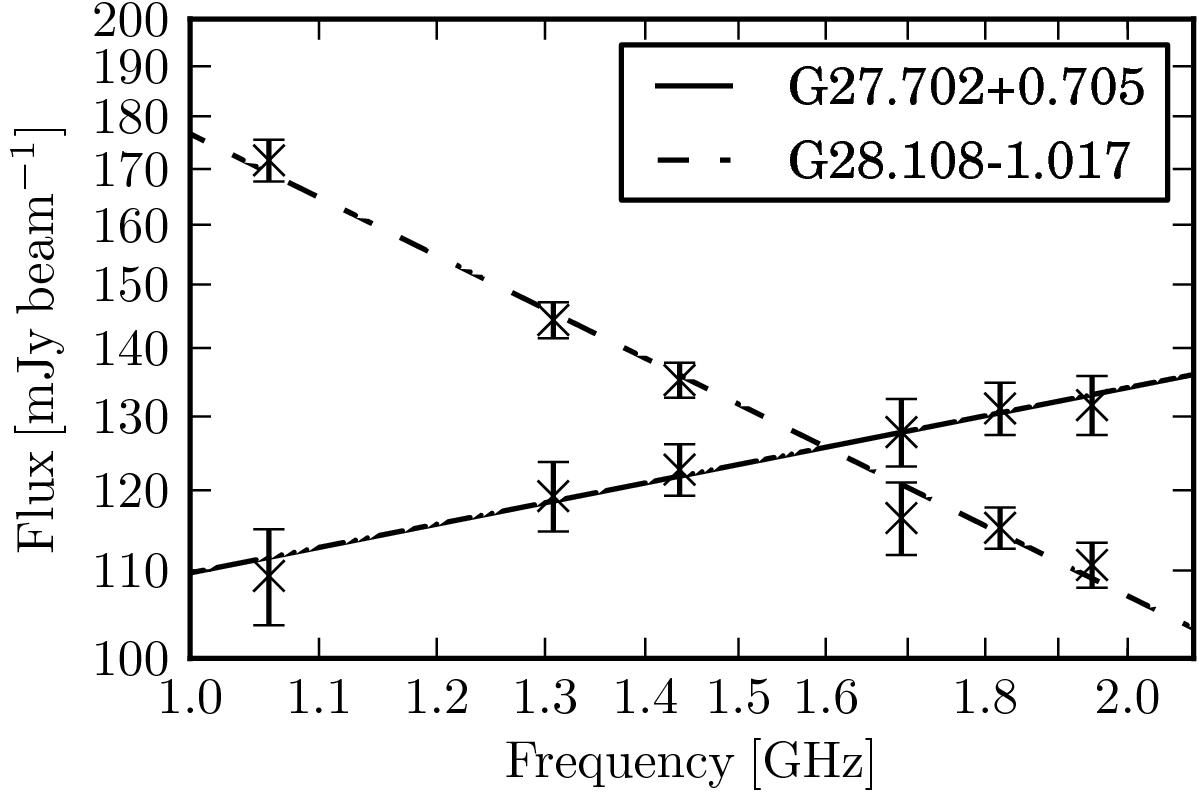
Example of the extracted peak intensity as a function of frequency. Each spectral window is represented by one data point including the 3σ uncertainty. G27.702+0.705 is represented by the solid line and has a spectral index of α = 0.29 ± 0.03, whereas G28.108-1.017 is represented by the dashed line and has a spectral index of α = −0.72 ± 0.02.
Current usage metrics show cumulative count of Article Views (full-text article views including HTML views, PDF and ePub downloads, according to the available data) and Abstracts Views on Vision4Press platform.
Data correspond to usage on the plateform after 2015. The current usage metrics is available 48-96 hours after online publication and is updated daily on week days.
Initial download of the metrics may take a while.