Fig. 6
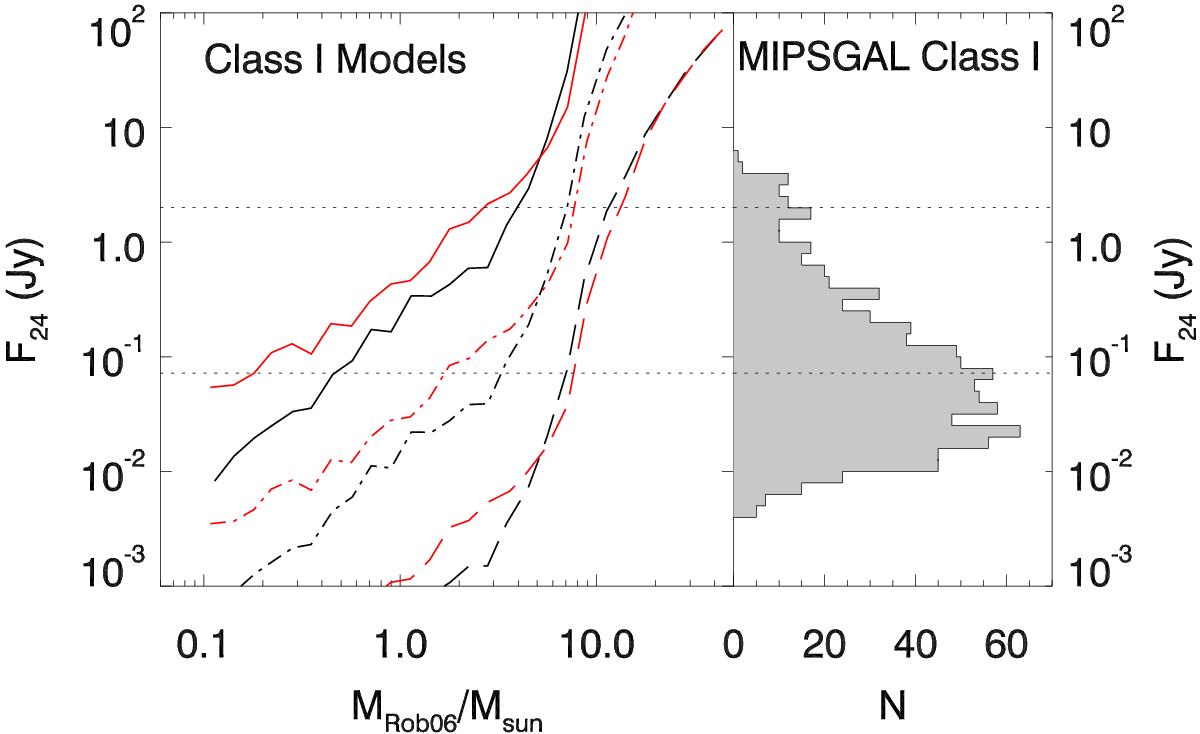
Left: variation of mean 24 μm flux within bins of protostellar mass and mass accretion rates 10-9 ≤ Ṁdisk< 10-7M⊙ yr-1 (black) and 10-7 ≤ Ṁdisk< 10-5M⊙ yr-1 (red) derived from the YSO models of Robitaille et al. (2006) and 3 distances (1 kpc (solid line), 4 kpc (dot-dashed lines) and 20 kpc (dashed lines). Right: distribution of 24 μm fluxes for early stage YSOs linked to ATLASGAL clumps. The upper horizontal dotted line corresponds to the flux level at which the MIPS detectors saturate. The lower horizontal line shows the flux at which MIPSGAL is at least 90% complete for this sample of ATLASGAL clumps.
Current usage metrics show cumulative count of Article Views (full-text article views including HTML views, PDF and ePub downloads, according to the available data) and Abstracts Views on Vision4Press platform.
Data correspond to usage on the plateform after 2015. The current usage metrics is available 48-96 hours after online publication and is updated daily on week days.
Initial download of the metrics may take a while.