Open Access
Fig. 1
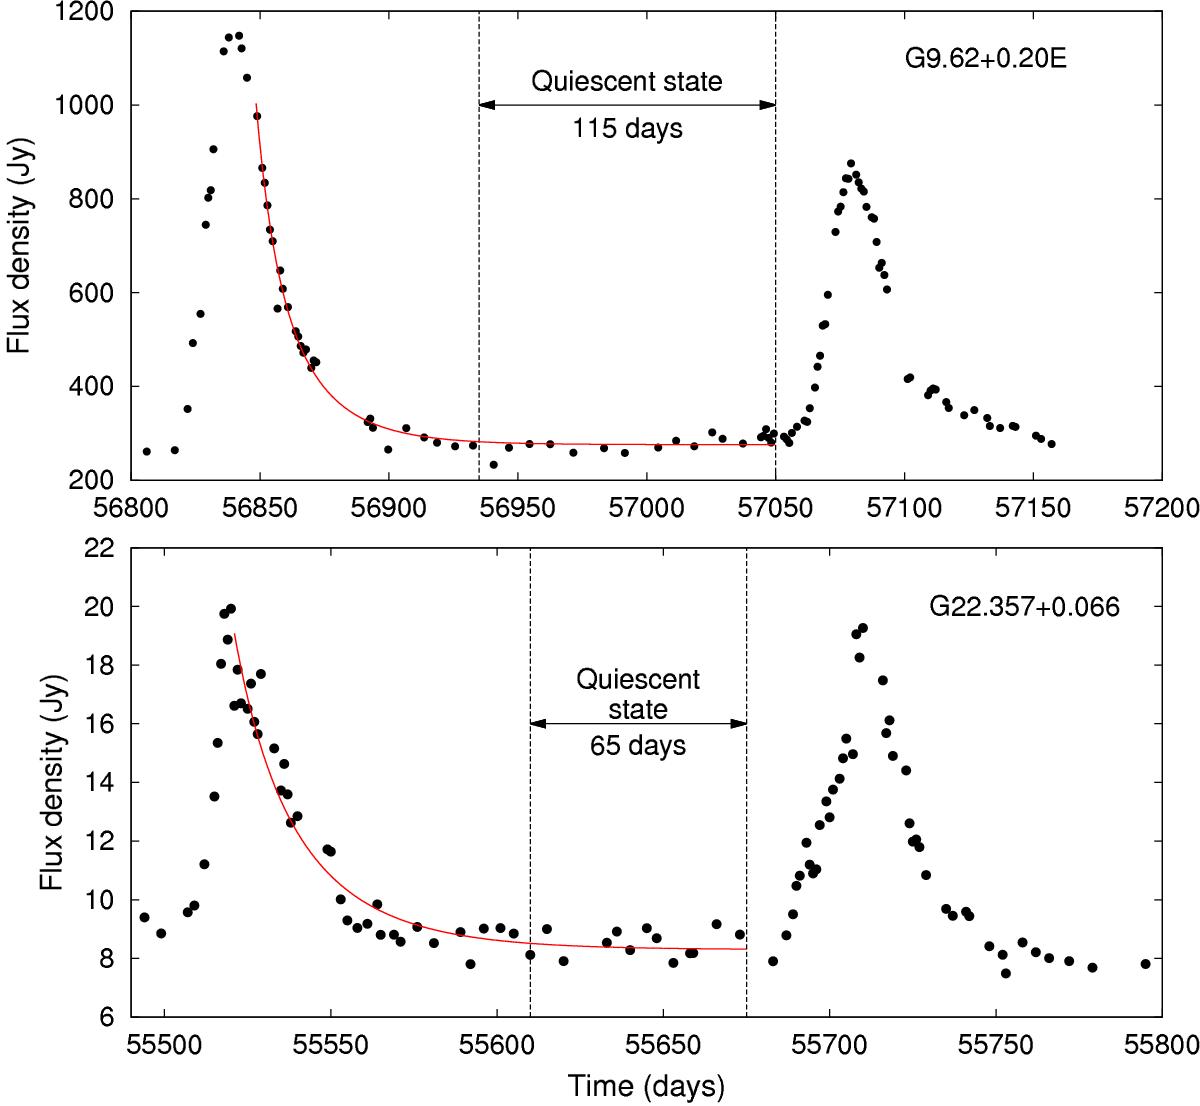
Selected parts of the timeseries for the 1.25 km s-1 feature at 12.2 GHz for G9.62+0.20E (top panel) and the 80.09 km s-1 at 6.7 GHz for G22.357+0.066. The red solid line in each of the panels is a fit to the decay parts of Eq. (A.7) of van der Walt et al. (2009). The interval of the quiescent state was estimated by eye.
Current usage metrics show cumulative count of Article Views (full-text article views including HTML views, PDF and ePub downloads, according to the available data) and Abstracts Views on Vision4Press platform.
Data correspond to usage on the plateform after 2015. The current usage metrics is available 48-96 hours after online publication and is updated daily on week days.
Initial download of the metrics may take a while.