Free Access
Fig. 7
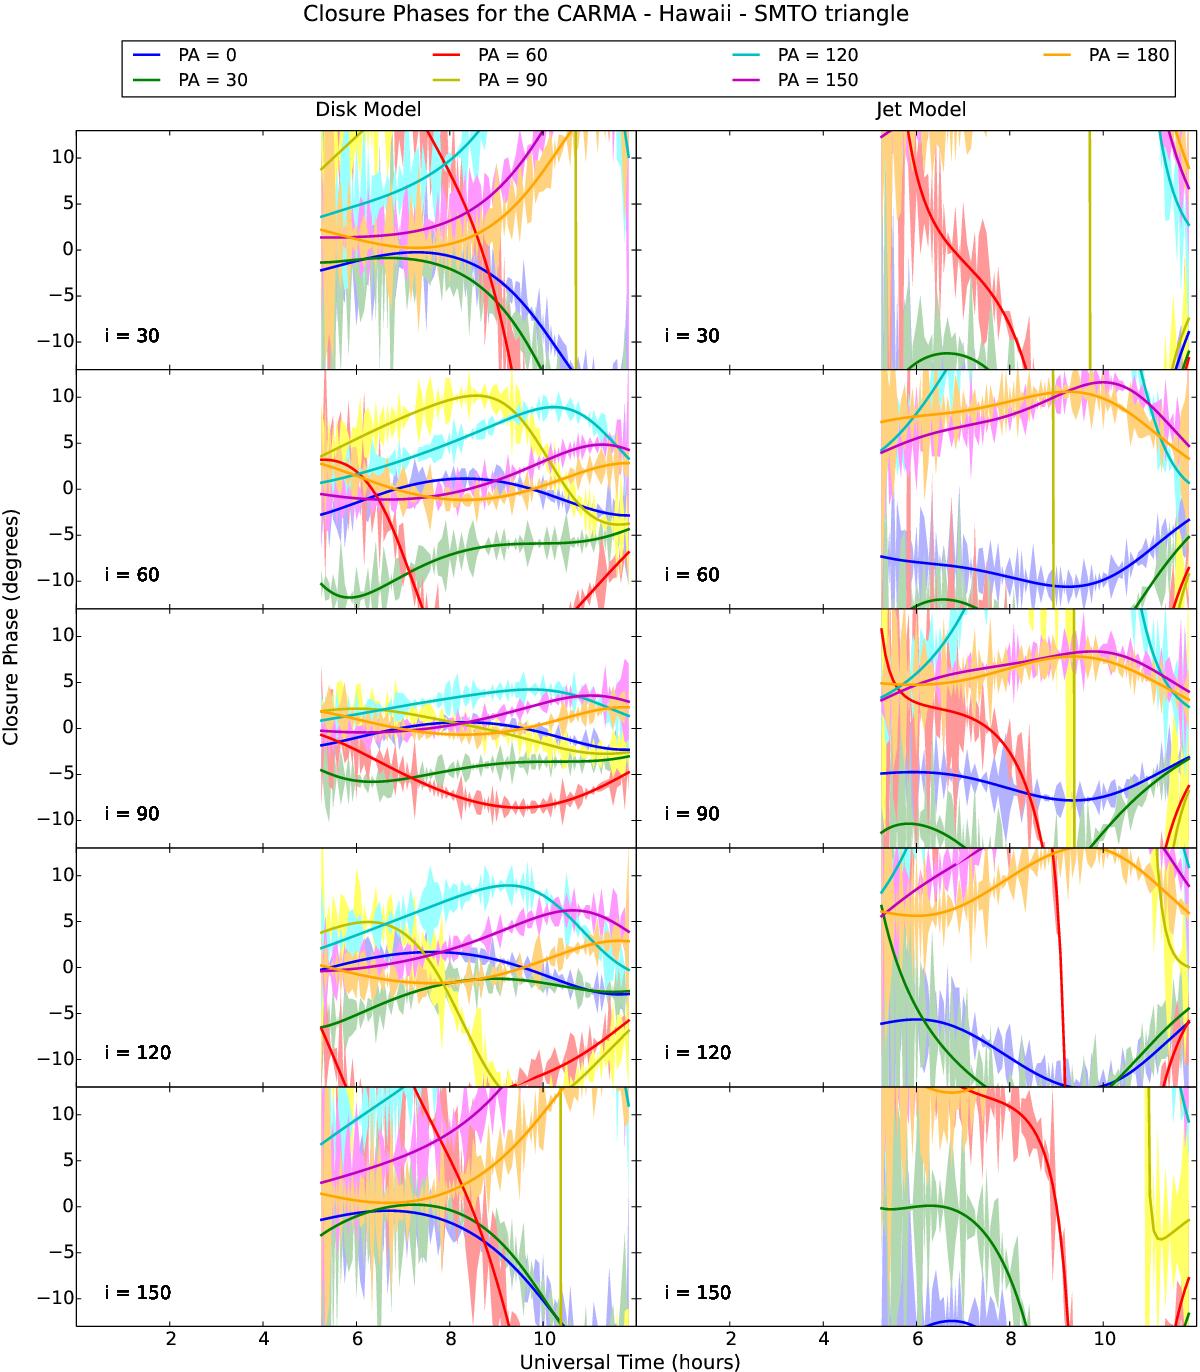
Same as Fig. 6, but zooming-in into the area of interest. The y-axis range has been set to ±13°, this limit represents the most likely values for closure phase as shown in the models by Broderick et al. (2011a). Solid lines are closure phases without noise, shaded areas represent the noise for the corresponding curve.
Current usage metrics show cumulative count of Article Views (full-text article views including HTML views, PDF and ePub downloads, according to the available data) and Abstracts Views on Vision4Press platform.
Data correspond to usage on the plateform after 2015. The current usage metrics is available 48-96 hours after online publication and is updated daily on week days.
Initial download of the metrics may take a while.