Fig. 5
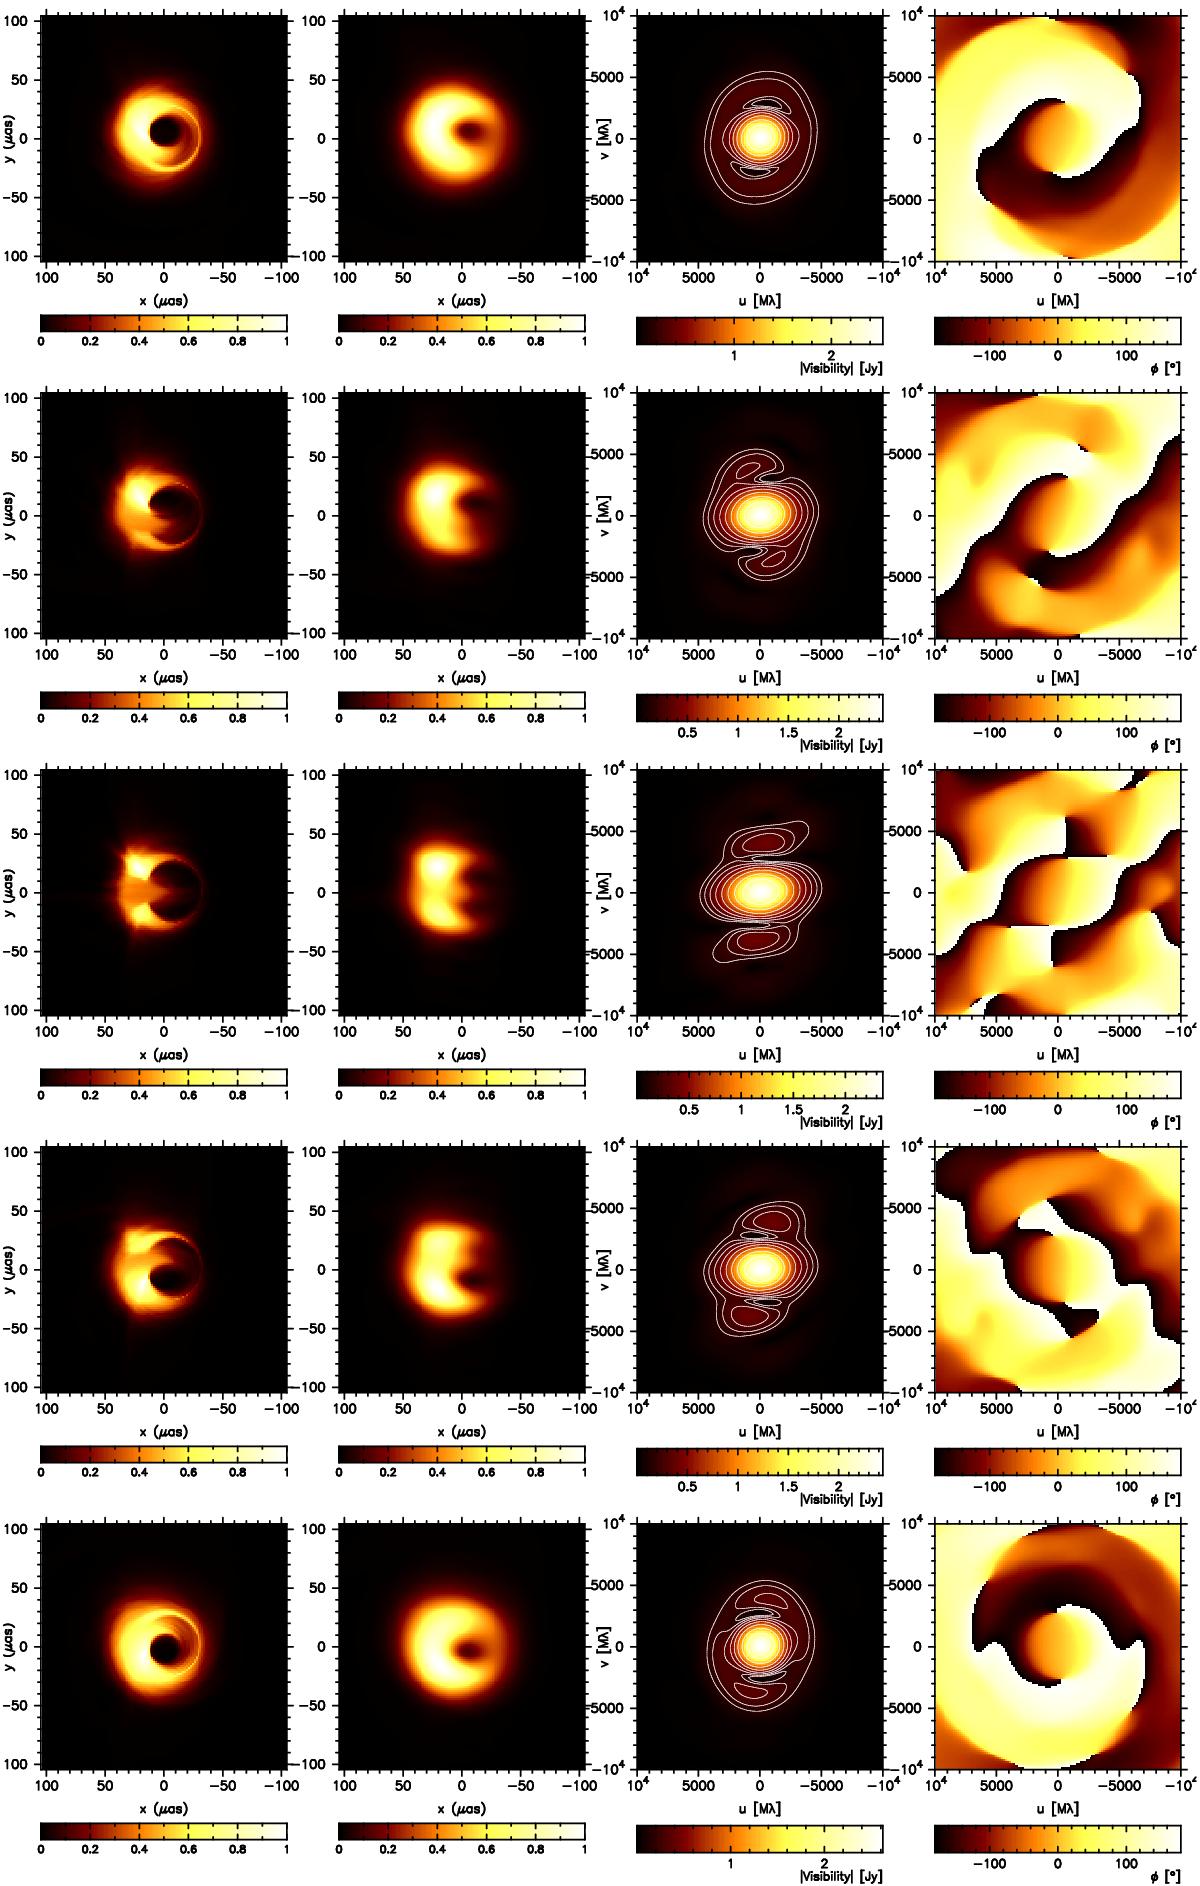
Jet model at λ = 1.3 mm (here BH spin PA = 0°). Rows show inclinations of 30°, 60°, 90°, 120°, and 150°from top to bottom. Left to right panels show an image of the jet model, that image convolved with the scattering screen, the visibility amplitude, and the visibility phase of the scatter-broadened images. The color intensity for the panels in the first two columns indicates the intensity of radiation, which has been normalized to unity. In the third column the color intensity indicates the amplitude of the visibility in Jy and contours are spaced by a factor of ![]() . The last column shows the corresponding map of the visibility phase. The range of uv-values for Cols. 3 and 4 is the same.
. The last column shows the corresponding map of the visibility phase. The range of uv-values for Cols. 3 and 4 is the same.
Current usage metrics show cumulative count of Article Views (full-text article views including HTML views, PDF and ePub downloads, according to the available data) and Abstracts Views on Vision4Press platform.
Data correspond to usage on the plateform after 2015. The current usage metrics is available 48-96 hours after online publication and is updated daily on week days.
Initial download of the metrics may take a while.