Fig. 8
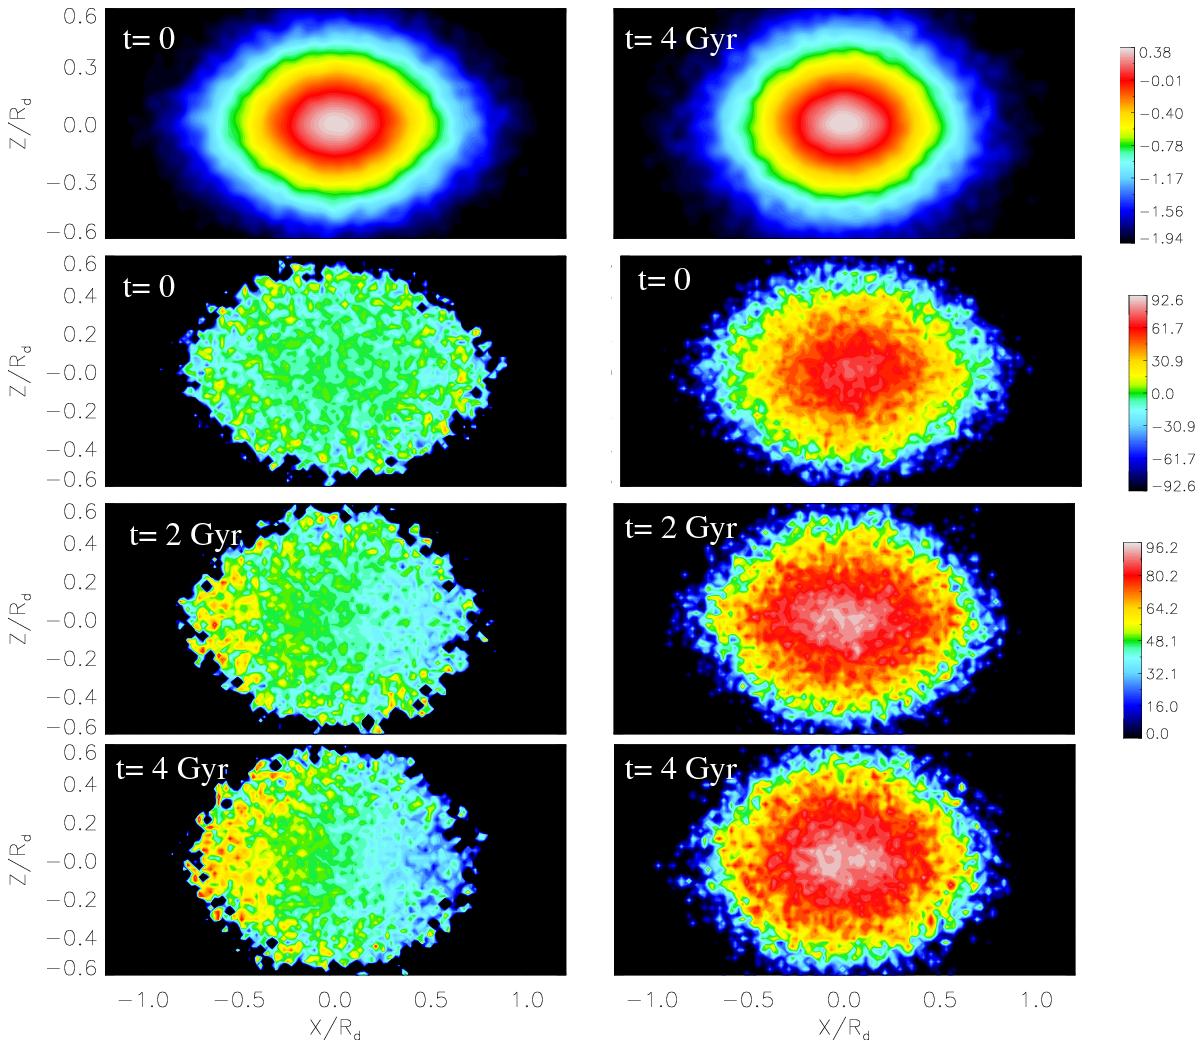
Surface density (upper panel), line-of-sight velocity and velocity dispersion maps (2nd to 4th panels) of the ClB in RHG097 at different times during the evolution. These images are taken at 90° projection (edge-on view) and the major axis of the bar is aligned with the X-axis. Clear signatures of rotation are seen at 4 Gyr. The colour bar at the top represents density, middle the velocity, and bottom the velocity dispersion.
Current usage metrics show cumulative count of Article Views (full-text article views including HTML views, PDF and ePub downloads, according to the available data) and Abstracts Views on Vision4Press platform.
Data correspond to usage on the plateform after 2015. The current usage metrics is available 48-96 hours after online publication and is updated daily on week days.
Initial download of the metrics may take a while.