Fig. 1
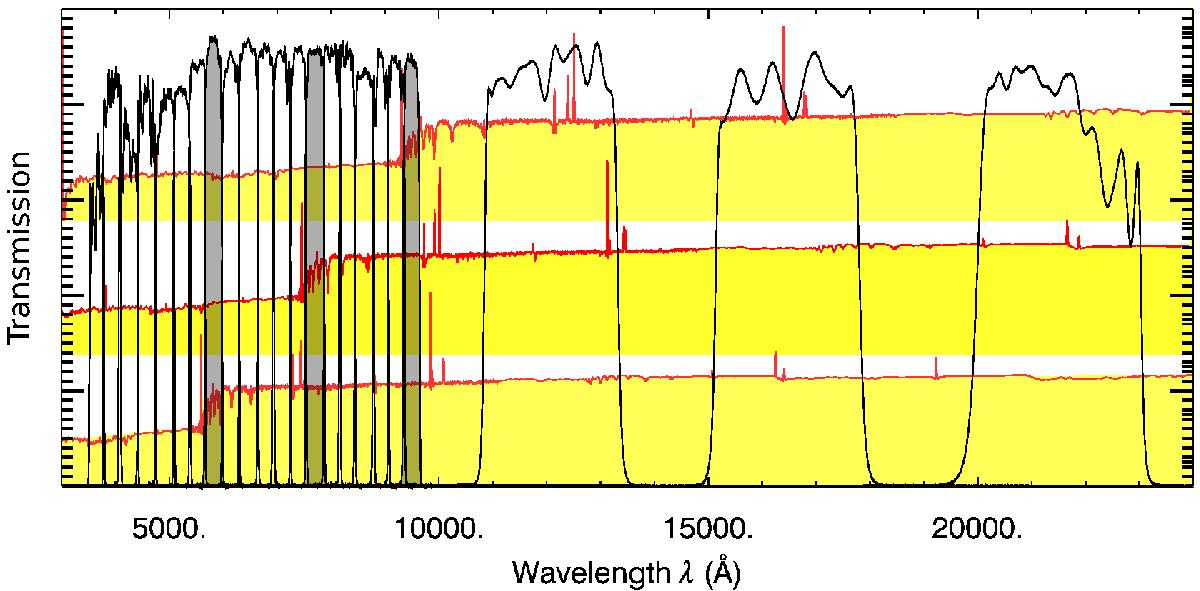
ALHAMBRA filter transmission curve covering the optical to NIR. From top to bottom, the red curves show the typical redshifted spectrum of a star-forming galaxy at z ~ 1.5, z ~ 1.0 and z ~ 0.5. The gray shaded areas mark the position of the ALHAMBRA filters R8, I14, and z20, which highlights the position of the Balmer jump. To select the BJG samples, we use the filter directly redward of the gray filter to sample the end position of the Balmer jump.
Current usage metrics show cumulative count of Article Views (full-text article views including HTML views, PDF and ePub downloads, according to the available data) and Abstracts Views on Vision4Press platform.
Data correspond to usage on the plateform after 2015. The current usage metrics is available 48-96 hours after online publication and is updated daily on week days.
Initial download of the metrics may take a while.