Fig. 3
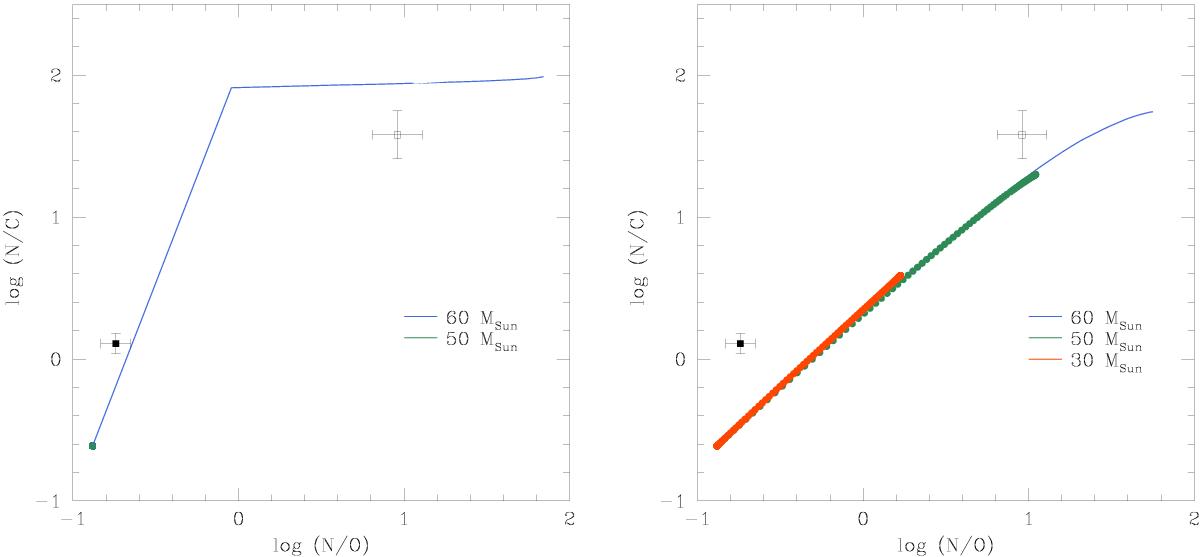
Comparison of the N/C and N/O ratios determined from our spectral analyses with predictions from single-star evolutionary models of different masses (Ekström et al. 2012). The primary and secondary stars are shown by the open and filled square symbols, respectively. The left panel illustrates the results for core hydrogen-burning phase tracks without stellar rotation, whilst the right panel corresponds to the same tracks for stars rotating at 0.4 × vcrit.
Current usage metrics show cumulative count of Article Views (full-text article views including HTML views, PDF and ePub downloads, according to the available data) and Abstracts Views on Vision4Press platform.
Data correspond to usage on the plateform after 2015. The current usage metrics is available 48-96 hours after online publication and is updated daily on week days.
Initial download of the metrics may take a while.