Fig. A.2
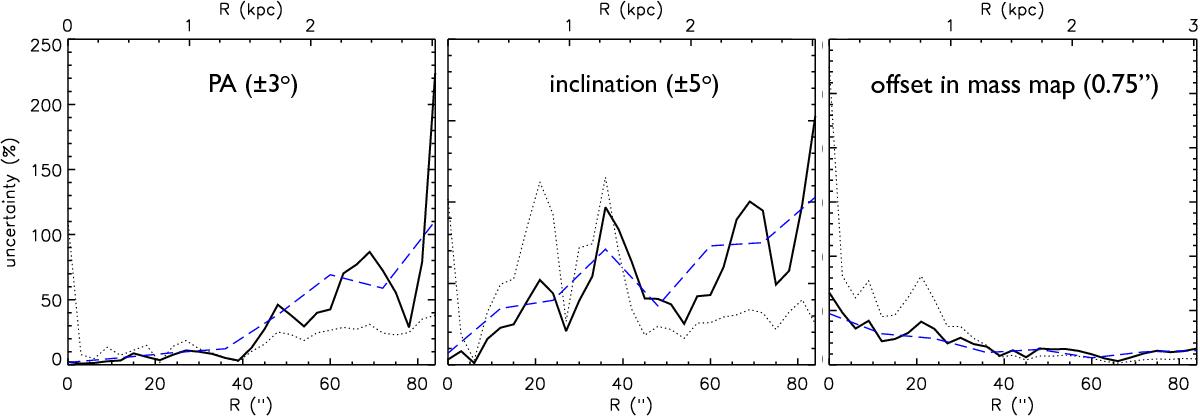
Radial dependence of uncertainties associated with PA (± 3°), inclination (± 5°) and an offset of 1px in the centring of the NIR image. The continuous black line shows the effect on torques, the dotted line corresponds to the effect on the local flow rates, and the dashed blue line is the average tendency (effect on torques averaged over of regions of ~400 pc).
Current usage metrics show cumulative count of Article Views (full-text article views including HTML views, PDF and ePub downloads, according to the available data) and Abstracts Views on Vision4Press platform.
Data correspond to usage on the plateform after 2015. The current usage metrics is available 48-96 hours after online publication and is updated daily on week days.
Initial download of the metrics may take a while.