Free Access
Fig. 7
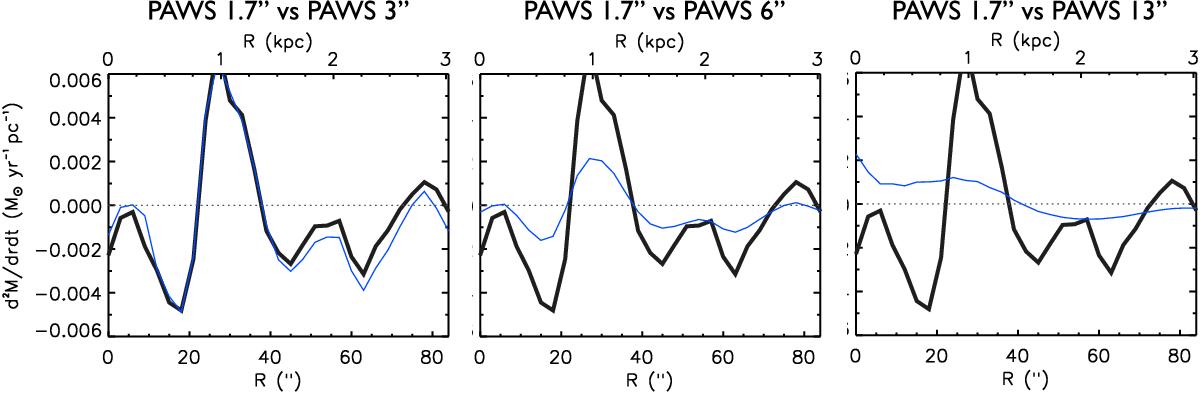
Change in the torques that is due to the use of a gas map with different spatial resolutions. The thick blue line corresponds to the PAWS CO(1–0) intensity map at the resolution of the stellar mass map (1.7′′), the blue line in the profiles from left to right correspond to the same PAWS map smoothed to 3′′, 6′′ and 13′′.
Current usage metrics show cumulative count of Article Views (full-text article views including HTML views, PDF and ePub downloads, according to the available data) and Abstracts Views on Vision4Press platform.
Data correspond to usage on the plateform after 2015. The current usage metrics is available 48-96 hours after online publication and is updated daily on week days.
Initial download of the metrics may take a while.