Fig. 5
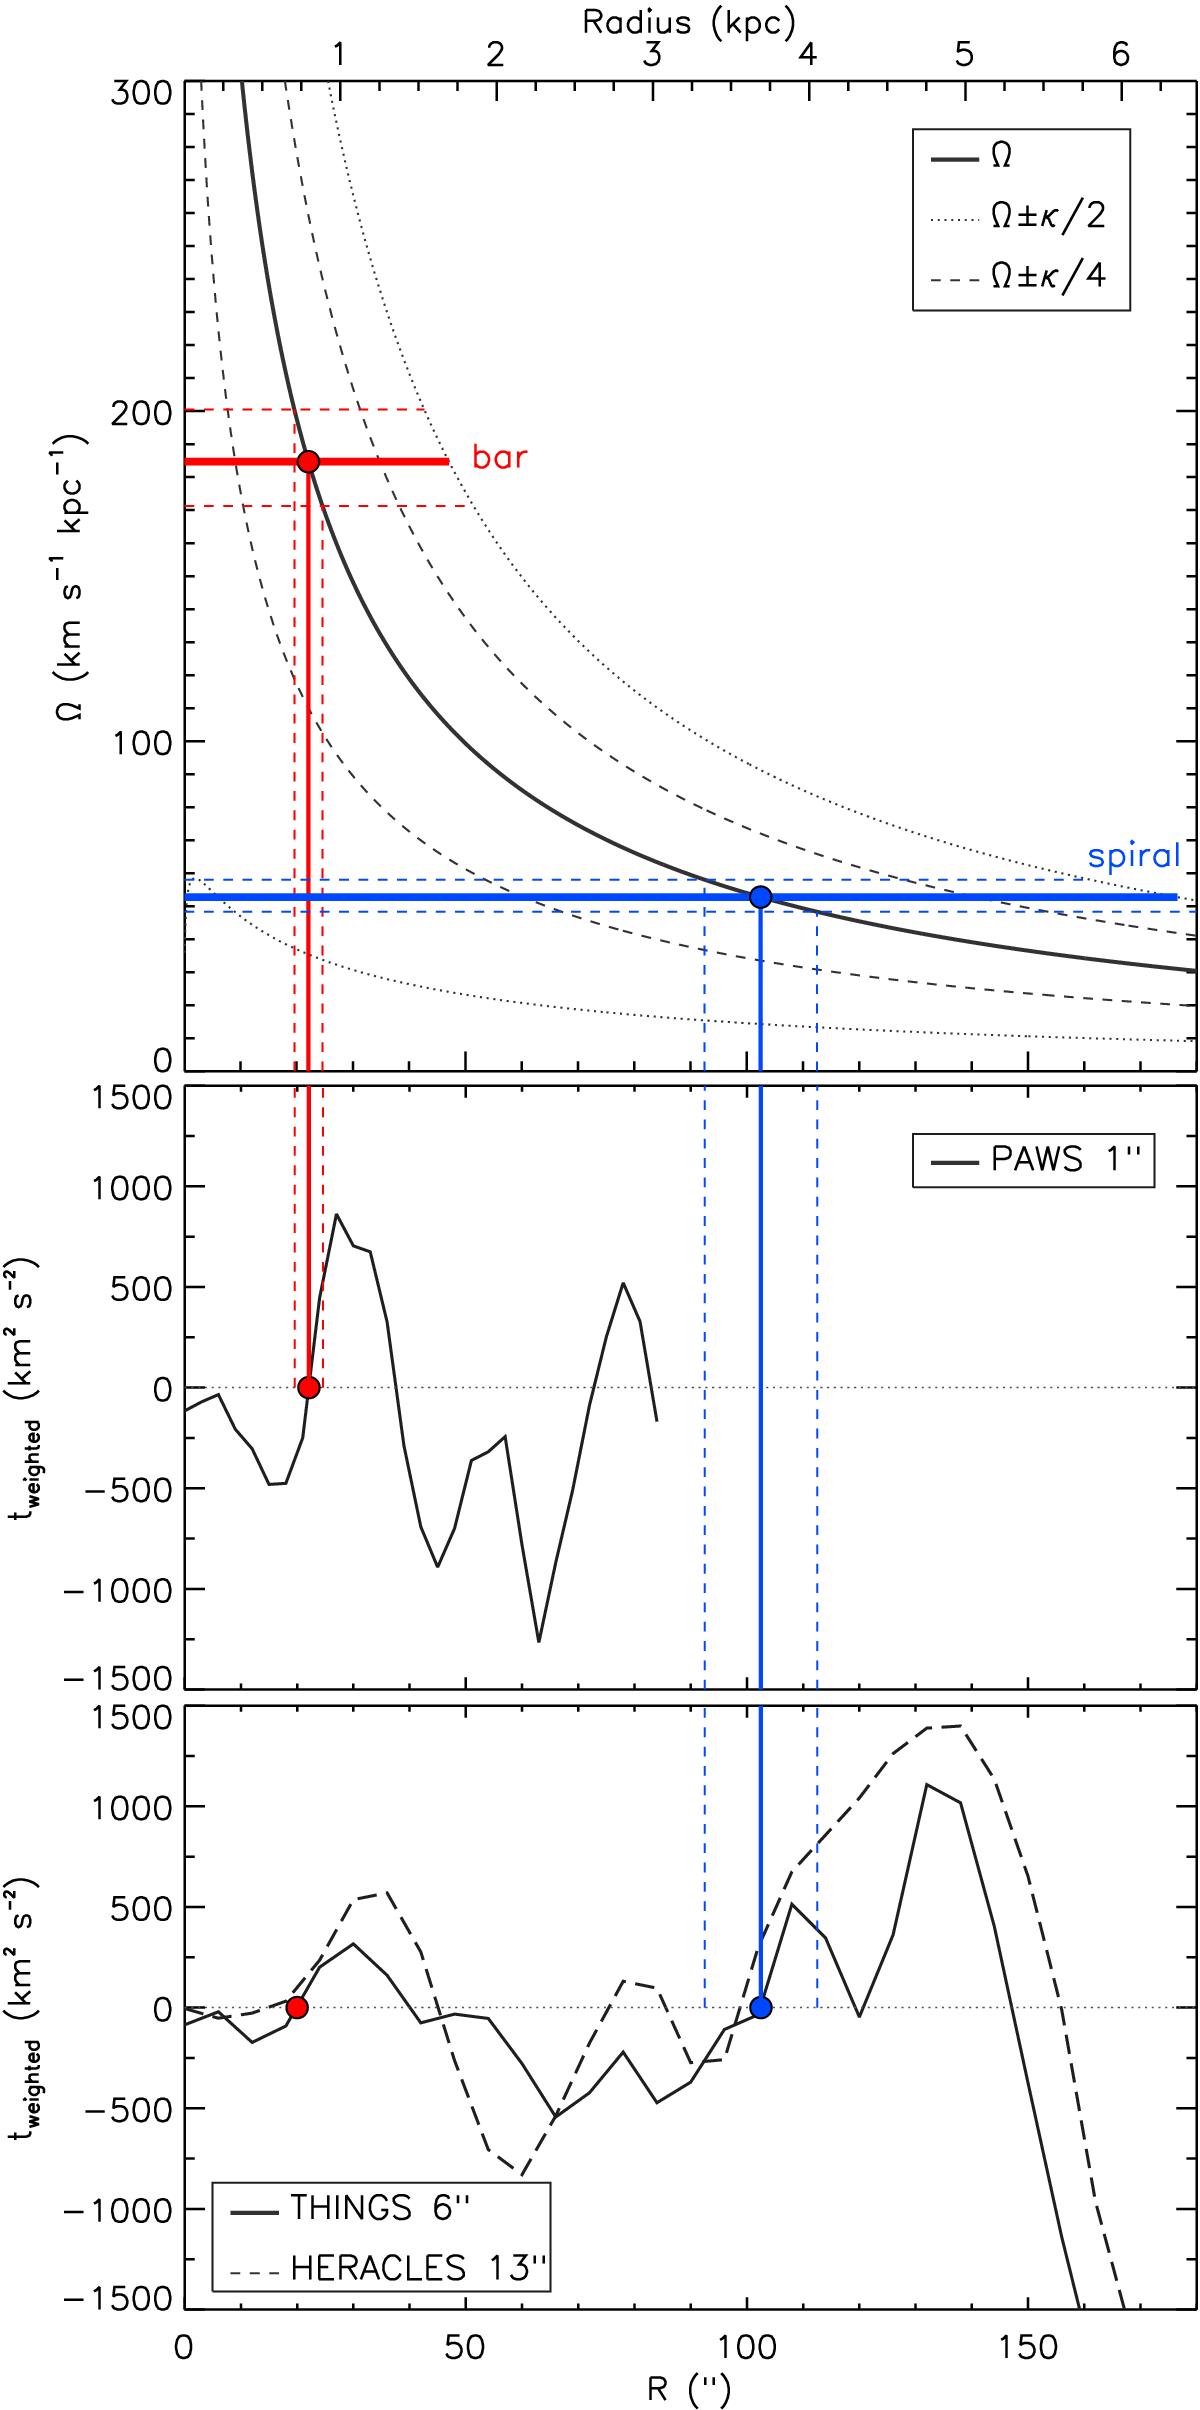
Top panel: angular frequency plot based on the rotation curve of M 51 calculated in Meidt et al. (2013): Ω (solid black), Ω ± κ/ 2 (dotted black), Ω ± κ/ 4 (dashed black). The red circle indicates the crossing of the estimated corotation radius of the bar (CRbar = (22 ± 2.5)′′) with the angular frequency curve Ω, which implies a bar pattern speed of ![]() km s-1 kpc-1 (horizontal red line). The blue circle shows the analogous crossing of the suggested corotation radius of the spiral (CRsp = (102 ± 10)′′), implying a pattern speed for the spiral of
km s-1 kpc-1 (horizontal red line). The blue circle shows the analogous crossing of the suggested corotation radius of the spiral (CRsp = (102 ± 10)′′), implying a pattern speed for the spiral of ![]() km s-1 kpc-1 (horizontal blue line). Middle panel: torque profile weighted by the PAWS gas distribution (same as Fig. 4, reproduced here for comparison). As a result of the smaller field of view of PAWS, the profile stops at R = 85′′. Bottom panel: torque profile weighted by the gas emission traced by THINGS (solid line) and HERACLES (dashed line).
km s-1 kpc-1 (horizontal blue line). Middle panel: torque profile weighted by the PAWS gas distribution (same as Fig. 4, reproduced here for comparison). As a result of the smaller field of view of PAWS, the profile stops at R = 85′′. Bottom panel: torque profile weighted by the gas emission traced by THINGS (solid line) and HERACLES (dashed line).
Current usage metrics show cumulative count of Article Views (full-text article views including HTML views, PDF and ePub downloads, according to the available data) and Abstracts Views on Vision4Press platform.
Data correspond to usage on the plateform after 2015. The current usage metrics is available 48-96 hours after online publication and is updated daily on week days.
Initial download of the metrics may take a while.