Fig. 4
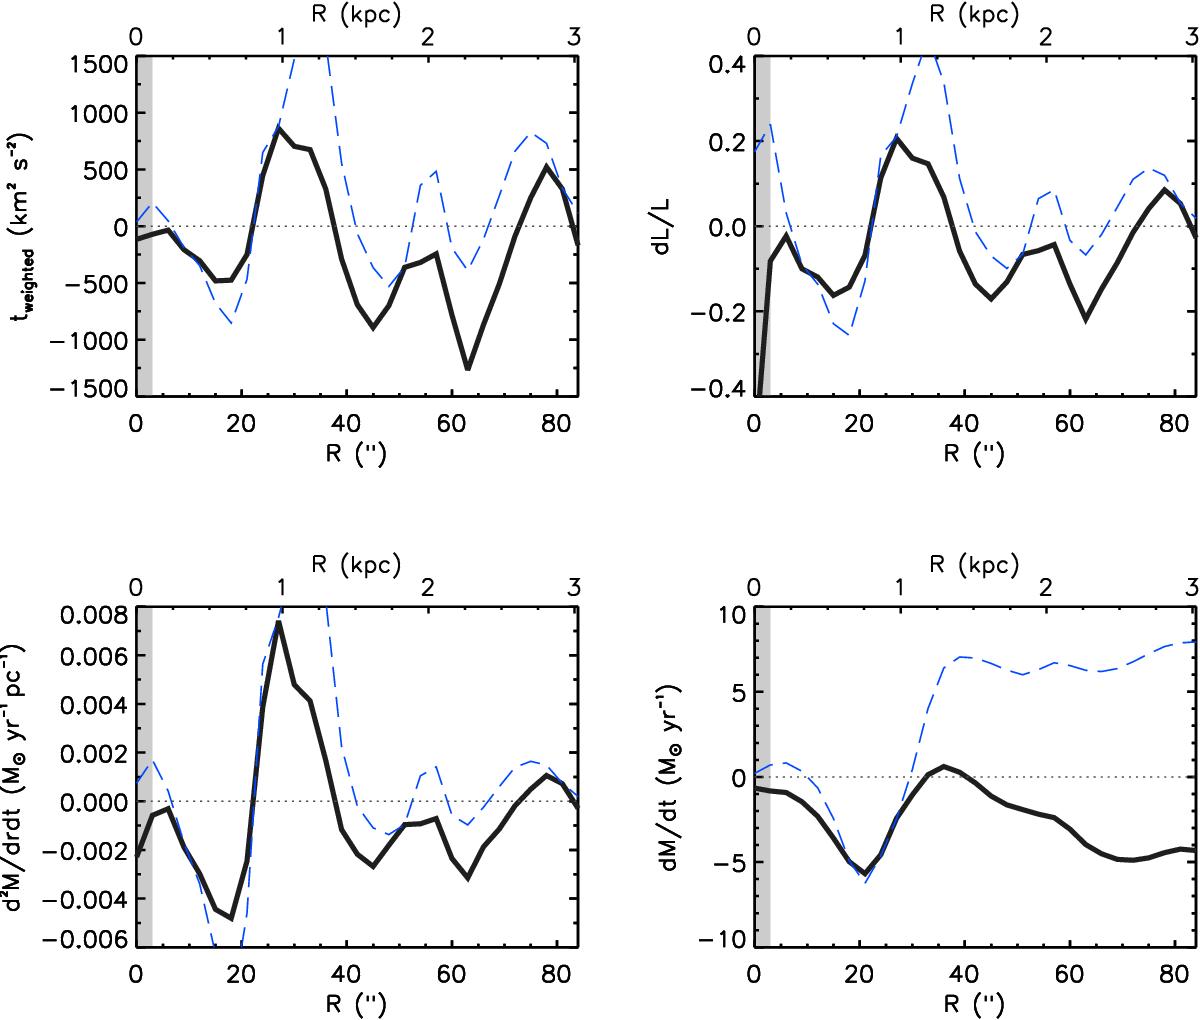
Results of the gravitational torques (weighted with the molecular gas distribution), angular momentum transfer, and resulting gas flow, both in radial bins and integrated out to radius R for our ICA dust-corrected stellar mass map (solid black line) and the original 3.6 μm image (dashed blue line). Positive values imply radial gas outflow, negative values denote an inflow. The innermost bin has been shaded to emphasise that it is subject to high uncertainties.
Current usage metrics show cumulative count of Article Views (full-text article views including HTML views, PDF and ePub downloads, according to the available data) and Abstracts Views on Vision4Press platform.
Data correspond to usage on the plateform after 2015. The current usage metrics is available 48-96 hours after online publication and is updated daily on week days.
Initial download of the metrics may take a while.