Fig. 3
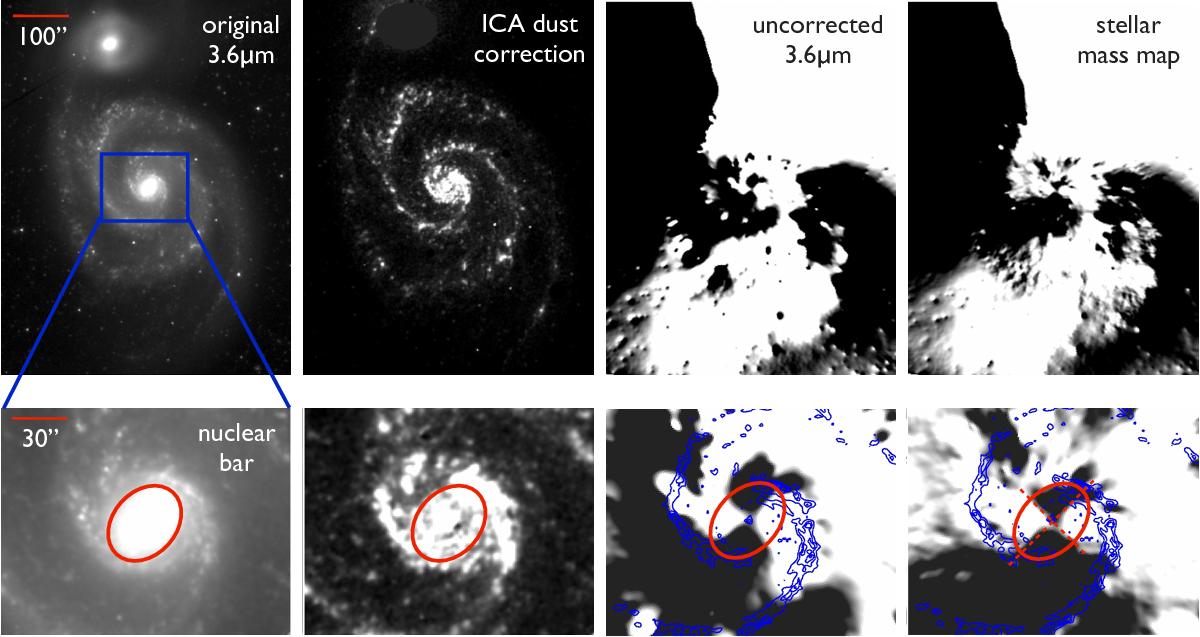
Top panel: original 3.6 μm image of M 51; dust emission identified with ICA (subtracted from the original image to produce the stellar mass map); gravitational torques, τ(x,y), based on the uncorrected 3.6 μm image of M 51 (assuming a constant M/L); same gravitational torques, τ(x,y), based on our ICA dust-corrected stellar mass map of M 51. Bottom panel: blow-up of the maps above, showing the area close to the nucleus. The red ellipse displays the shape of the nuclear bar, determined from the ellipticity and PA profiles measured by Muñoz-Mateos et al. (2015) at the radius where the bar ends (R = 20′′: ε = 0.262, PA = −42.6°); this agrees excellently well with an isocontour of F = 10 MJy/sr in the original 3.6 μm image. The red dashed lines are the approximate axes of symmetry of the bar, which coincide with a change of sign in the torques, following the expected butterfly pattern. The blue contours indicate CO emission from PAWS, from 50 to 250 K km s-1 in steps of 50 K km s-1. All images are shown in the plane of the sky; north is up (even if, naturally, torques are calculated in the plane of the galaxy). The scale bar shown in the leftmost images applies to the whole row. (The 3.6 μm image is shown in square-root scale to emphasise low-level structure in the range (0,10) MJy/sr; the dust map is displayed in linear scale, (0,3) MJy/sr; the torque maps are also shown on a linear scale, (− 1000,1000) km2 s-2, with negative torques in black and positive torques in white.)
Current usage metrics show cumulative count of Article Views (full-text article views including HTML views, PDF and ePub downloads, according to the available data) and Abstracts Views on Vision4Press platform.
Data correspond to usage on the plateform after 2015. The current usage metrics is available 48-96 hours after online publication and is updated daily on week days.
Initial download of the metrics may take a while.