Fig. A.4
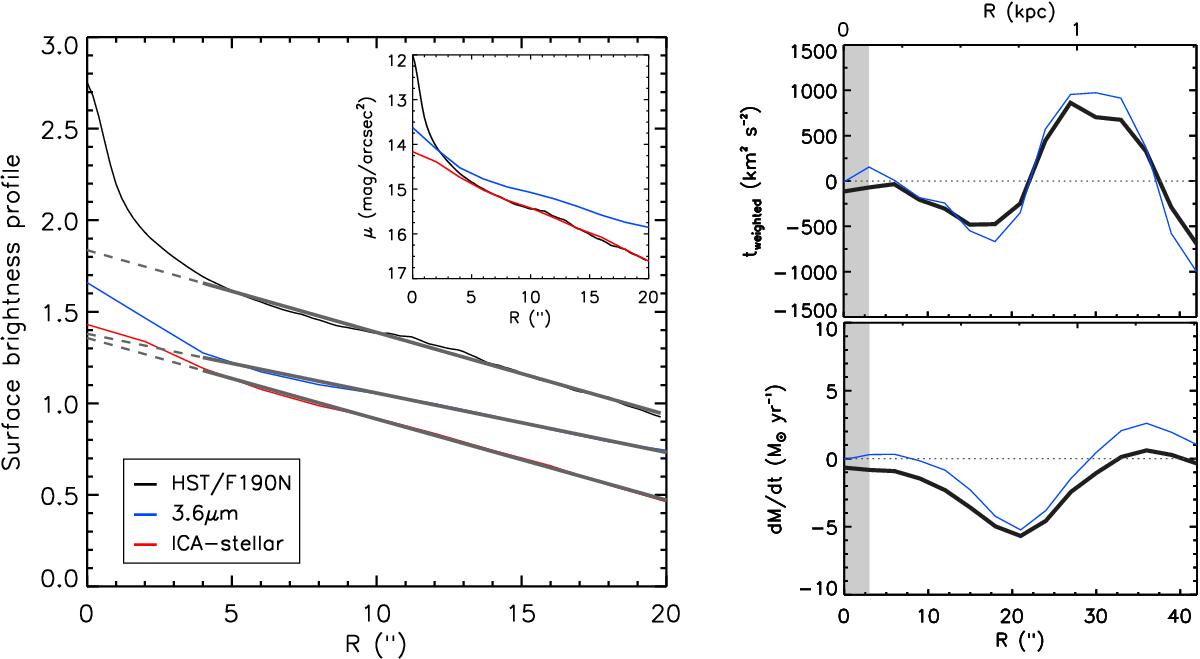
Left: radial surface brightness profiles for the HST/F190N narrow-band image of M 51, the uncorrected 3.6 μm, and the ICA-corrected 3.6 μm (stellar mass map) in units of log (Fν/ [ MJy / sr ]). The linear fits in the range 5−20′′ highlight the good agreement with the expectation from a simple Sérsic profile in this region and show that F190N and the stellar mass map have basically identical slopes. The small inset panel shows the equivalent surface brightness profiles in magnitude units (Vega): after accounting for the different zero points, the HST/F190N profile perfectly matches the levels of the stellar mass map. Right: radial torque profile (top) and accumulated inflow rates (bottom) for the gravitational potential based on HST/F190N (blue), compared with our fiducial stellar mass map (black). The blue profile should be regarded as an (extreme) upper limit, in which the “bump” in the central region of HST/F190N is entirely attributed to old stars (which is highly unlikely, as argued in the text). The reason for divergencies out to R ≲ 5′′ in the top plot (torques) to propagate farther out in the bottom plot (inflow) is that the bottom profile displays cumulative flow rates, and an offset in the inner bin will shift the whole profile up or down.
Current usage metrics show cumulative count of Article Views (full-text article views including HTML views, PDF and ePub downloads, according to the available data) and Abstracts Views on Vision4Press platform.
Data correspond to usage on the plateform after 2015. The current usage metrics is available 48-96 hours after online publication and is updated daily on week days.
Initial download of the metrics may take a while.