Fig. A.3
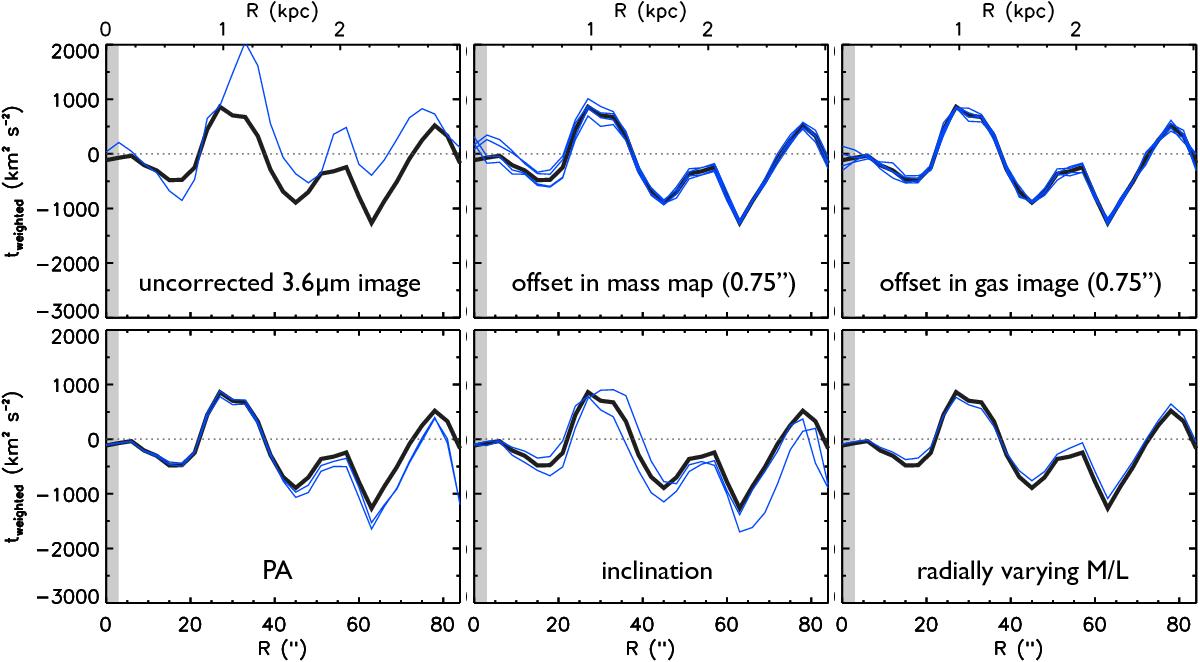
Change in the torque profiles due to a number of systematic uncertainties. The thick black line is our fiducial profile, based on the ICA dust-corrected 3.6 μm image. From top left to bottom right, the thin blue lines are the profiles based on the uncorrected 3.6 μm image (i.e. difference due to dust emission at 3.6 μm); an offset in the centring of the stellar mass map of 0.75′′; an offset in the centring of the gas map (CO traced by PAWS) of 0.75′′; a variation in the position angle of the disc corresponding to the extremes of the error bars given by Colombo et al. (2014); a variation in the inclination of the disc corresponding to the extremes of the error bars given by Colombo et al. (2014); and the difference in mass distribution associated with the maximum possible radially varying M/L.
Current usage metrics show cumulative count of Article Views (full-text article views including HTML views, PDF and ePub downloads, according to the available data) and Abstracts Views on Vision4Press platform.
Data correspond to usage on the plateform after 2015. The current usage metrics is available 48-96 hours after online publication and is updated daily on week days.
Initial download of the metrics may take a while.