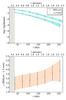
Fig. 9
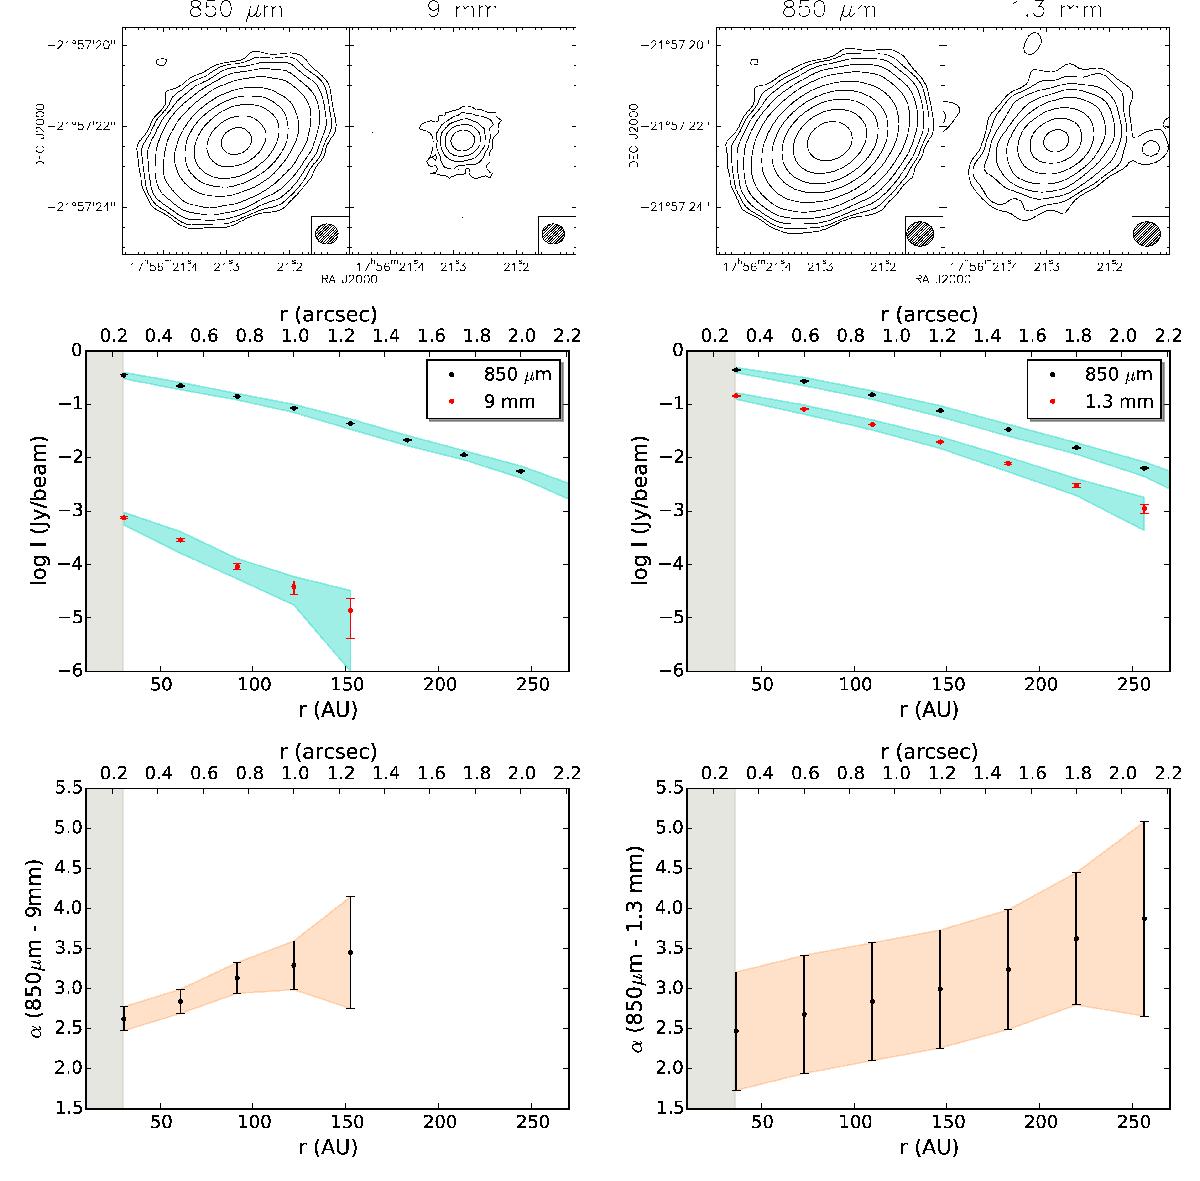
Left: flux density maps (top panel) at 850 μm and 9 mm with contour levels at −3 (dashed), 3, 6, 12, 24, 48, 100, 200, 400, 800, and 1600σ. Disk surface brightness profiles (middle panel) used to compute the spectral index, plotted on a logarithmic scale. The shaded region shows the dispersion of the individual data points in the images, while the error bars show the uncertainty on the mean for each bin. The flux density spectral index (bottom panel) was calculated between 850 μm and 9 mm as a function of radial distance. The profiles were averaged on ellipses of semi major axis r (shown in arcsec and AU in the top and bottom axes, respectively). The shaded region indicates the uncertainty of the measurement, resulting from the noise of the deconvolved images and the systematic calibration uncertainty; the low signal-to-noise ratio in the VLA map dominates the uncertainty on the spectral index determination beyond ~100 AU. Right: as above, but for the two ALMA datasets at 850 μm and 1.3 mm.
Current usage metrics show cumulative count of Article Views (full-text article views including HTML views, PDF and ePub downloads, according to the available data) and Abstracts Views on Vision4Press platform.
Data correspond to usage on the plateform after 2015. The current usage metrics is available 48-96 hours after online publication and is updated daily on week days.
Initial download of the metrics may take a while.