Fig. 7
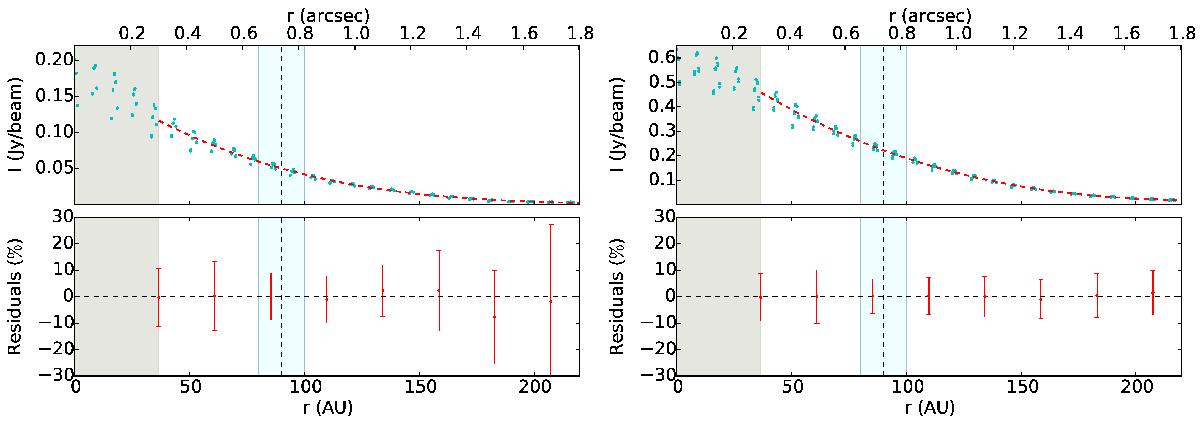
Left: radial profile at 1.3 mm across the disk major axis, with the dashed curve resulting from the polynomial fit of the data. Bottom panel: absolute residuals with respect to the polynomial interpolation. The excess emission found at 850 μm is not visible in Band 6. Right: radial profile of the image at 850 μm restored with the same beam as Band 6 (0.74′′ × 0.60′′, PA 77.3°).
Current usage metrics show cumulative count of Article Views (full-text article views including HTML views, PDF and ePub downloads, according to the available data) and Abstracts Views on Vision4Press platform.
Data correspond to usage on the plateform after 2015. The current usage metrics is available 48-96 hours after online publication and is updated daily on week days.
Initial download of the metrics may take a while.