Fig. 5
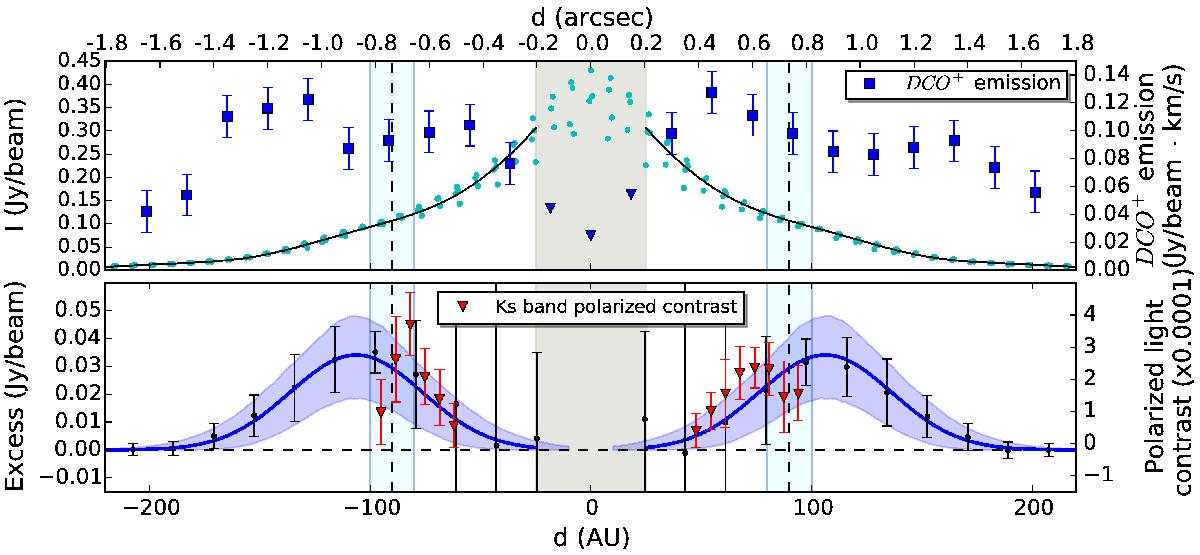
Top panel: flux density at 850 μm along the disk major axis from SE (left) to NW (right). The solid line represents the fit (polynomial profile + a Gaussian for the excess) performed excluding the inner 0.2 arcsec of the disk (gray shaded area). The vertical dashed line corresponds to the CO snowline at 90 ± 10 AU (from Qi et al. 2015). DCO+ emission in blue squares binned by 0.15 arcsec, the blue triangles show the upper limit of DCO+ emission in the inner 0.2 arcsec region of the disk, where we are limited by resolution. Bottom panel: residuals obtained by subtracting the polynomial fit from the data are shown with black dots binned by 0.15 arcsec. The blue solid line represents the Gaussian that best fits the excess (see Table 3), with the shaded area showing the 1σ fit uncertainty. The red triangles are the polarized light contrast in the Ks-band (from Garufi et al. 2014, the scale is on the right side vertical axis).
Current usage metrics show cumulative count of Article Views (full-text article views including HTML views, PDF and ePub downloads, according to the available data) and Abstracts Views on Vision4Press platform.
Data correspond to usage on the plateform after 2015. The current usage metrics is available 48-96 hours after online publication and is updated daily on week days.
Initial download of the metrics may take a while.