Fig. 4
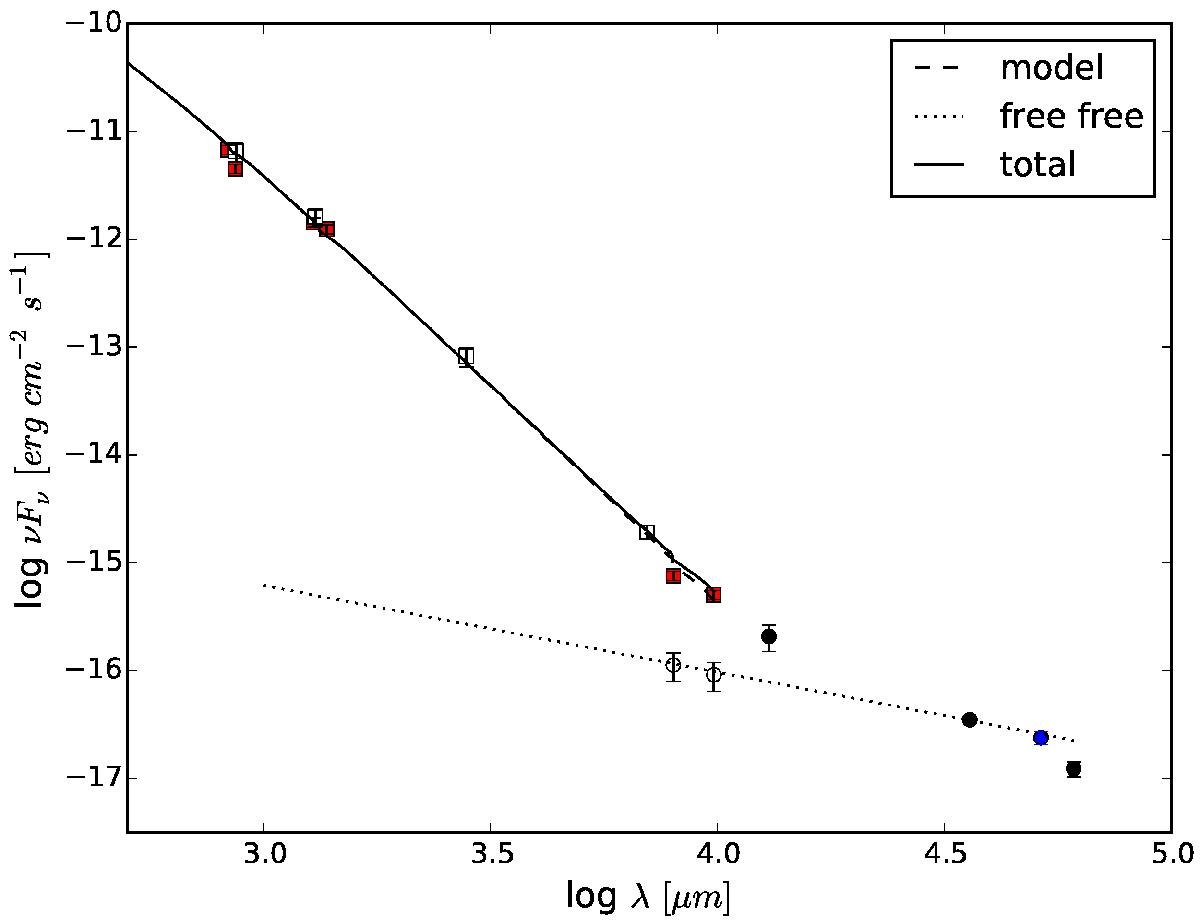
HD 163296 spectral energy distribution. Our measurements are represented in red filled squares, the white empty squares are taken from the literature (Isella et al. 2007; Natta et al. 2004), and the longer wavelength measurements used to evaluate the free free contribution are shown with full black circles (Natta et al. 2004) and a blue full circle (Disks@EVLA collaboration). Empty circles show the value of 0.3 mJy for the free free emission estimated in this paper. The dashed curve shows the best fit model from this paper (see Sect. 4), the dotted line is the estimated free-free emission, and the solid line the sum of the two.
Current usage metrics show cumulative count of Article Views (full-text article views including HTML views, PDF and ePub downloads, according to the available data) and Abstracts Views on Vision4Press platform.
Data correspond to usage on the plateform after 2015. The current usage metrics is available 48-96 hours after online publication and is updated daily on week days.
Initial download of the metrics may take a while.