Fig. 11
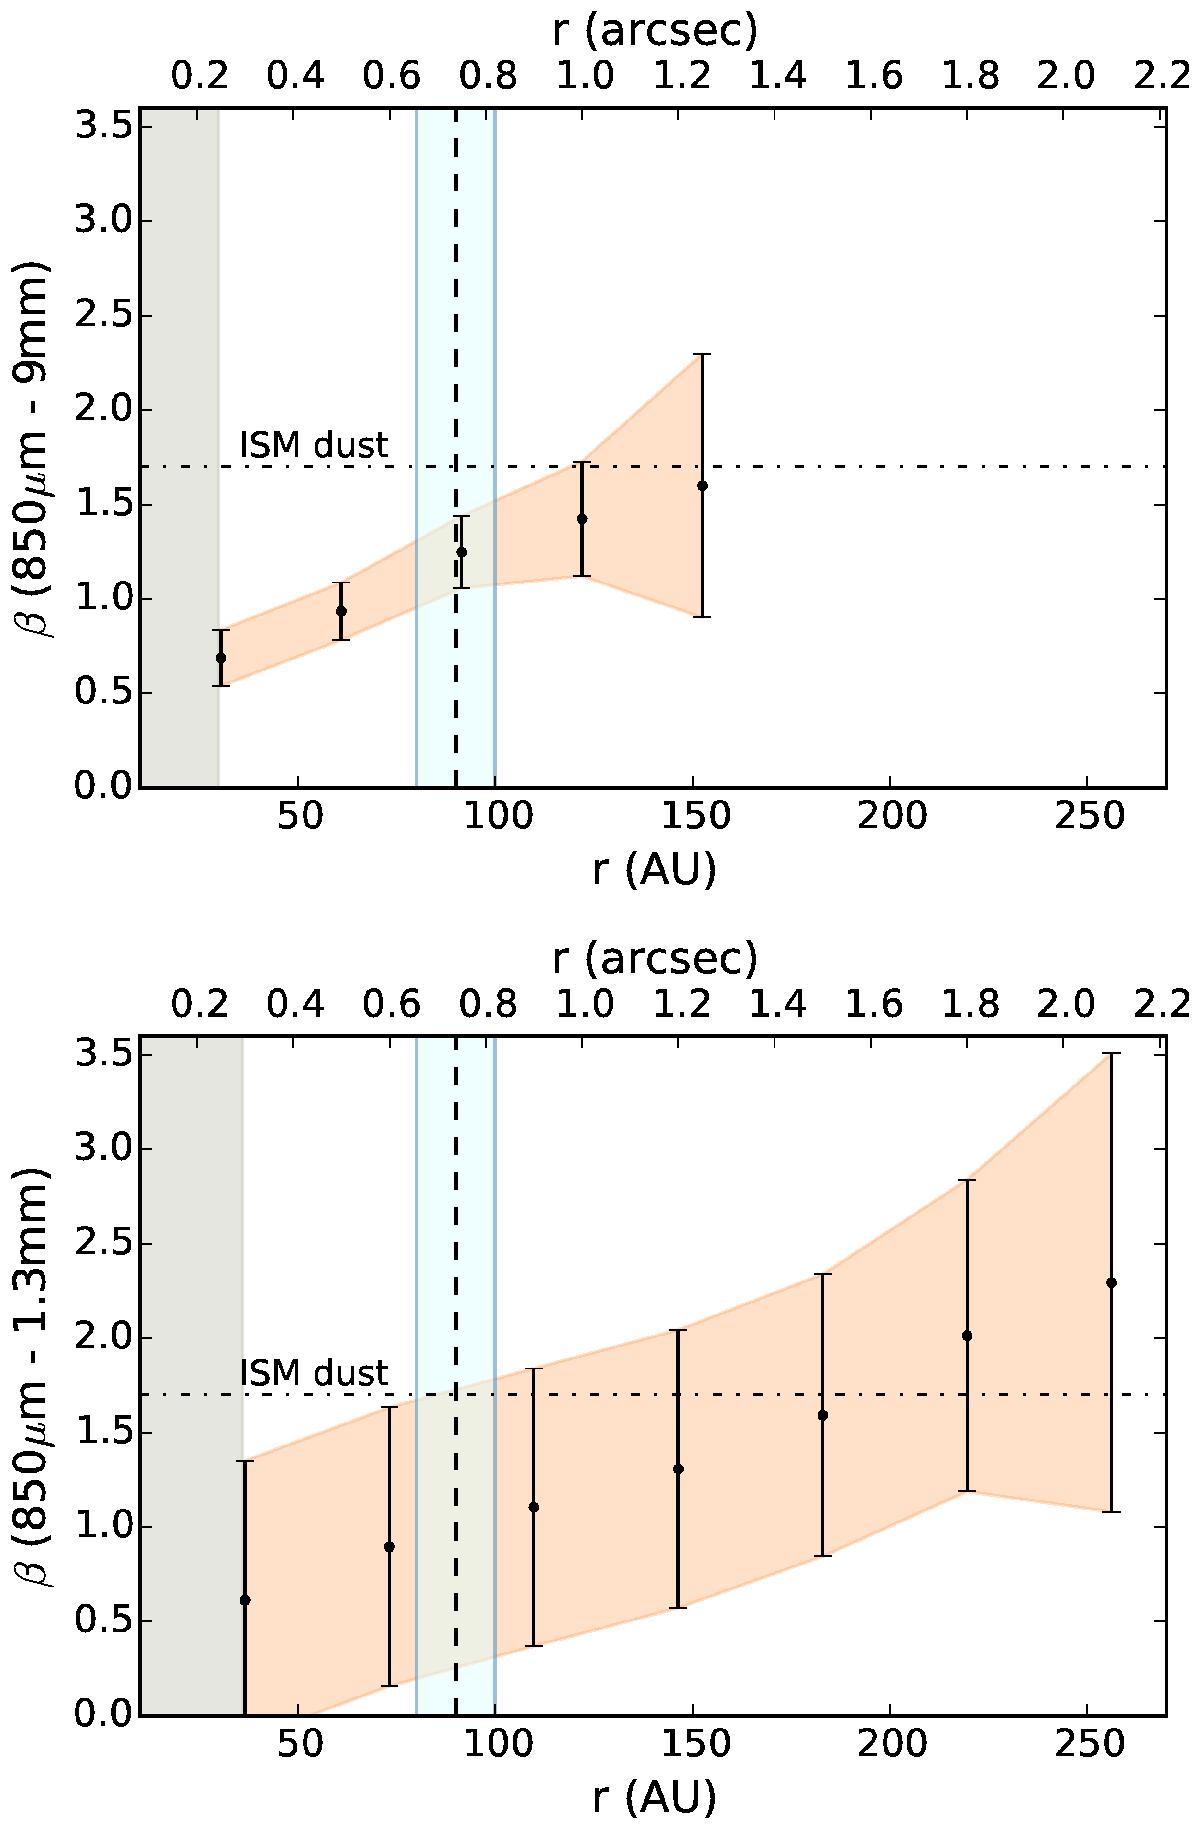
Dust opacity power-law index (β) profiles derived using Eq. (4). β(r) is computed between 850 μm and 9 mm in the top panel and between 850 μm and 1.3 mm in the bottom panel. The uncertainties are propagated from the surface brightness profiles presented in Fig. 9. The derived values of β(r) in the top panel are dominated by the low signal-to-noise in the VLA image from ~100 AU and are very uncertain beyond this radius. The CO snowline at 90 ± 10 AU from Qi et al. (2015) is pictured as the dashed vertical line.
Current usage metrics show cumulative count of Article Views (full-text article views including HTML views, PDF and ePub downloads, according to the available data) and Abstracts Views on Vision4Press platform.
Data correspond to usage on the plateform after 2015. The current usage metrics is available 48-96 hours after online publication and is updated daily on week days.
Initial download of the metrics may take a while.