Fig. 10
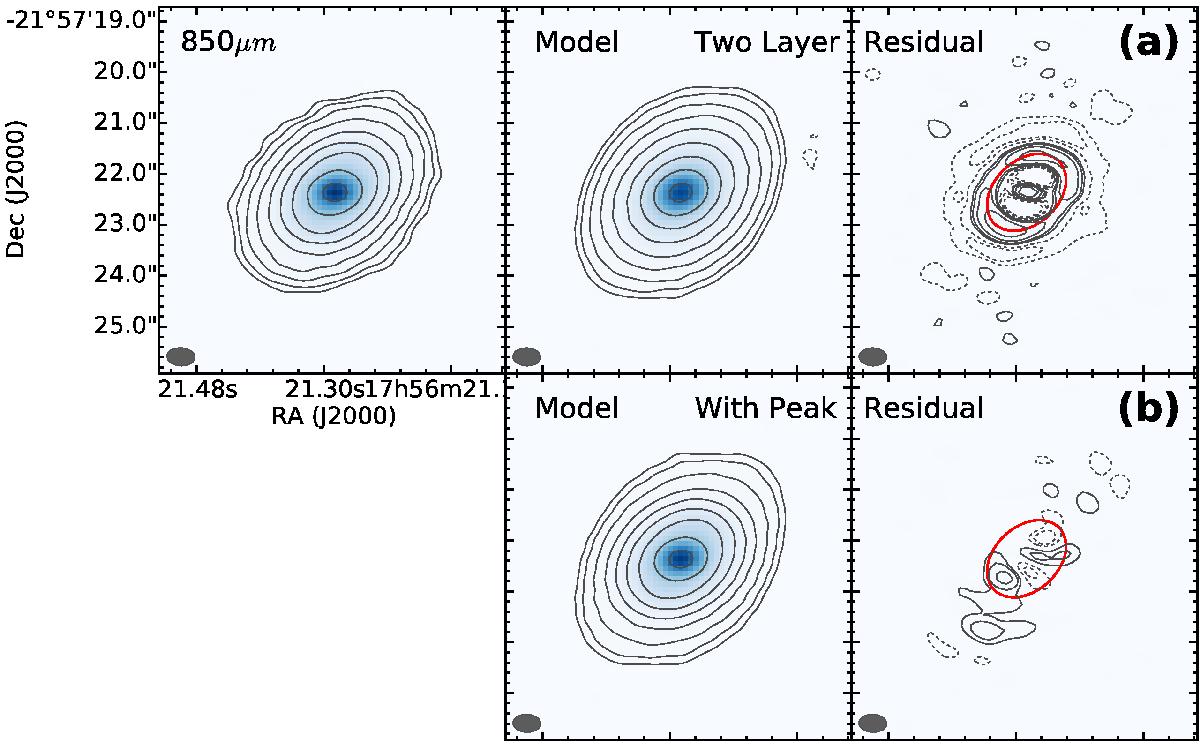
Continuum maps at 850 μm showing the results of the fits of the visibilities. The top left panel shows the observations, the two panels in the center the best-fit model, and the two panels on the right the residuals. The red solid curve represents the CO snowline at 90 AU. Panel a): we use a classical two-layer disk model that implements a monotonically decreasing surface brightness. Ring-shaped residuals are clearly visible. Panel b): we use the two layer disk model with an additional Gaussian peak. We fit the peak location (Rp = 96 AU) and width FWHMp = 58 AU. The residuals are substantially reduced. The parameters used for the CLEAN are the same as discussed in Sect. 2, and the contour levels are the same as those used in Figs. 1 and 9.
Current usage metrics show cumulative count of Article Views (full-text article views including HTML views, PDF and ePub downloads, according to the available data) and Abstracts Views on Vision4Press platform.
Data correspond to usage on the plateform after 2015. The current usage metrics is available 48-96 hours after online publication and is updated daily on week days.
Initial download of the metrics may take a while.