Fig. 6
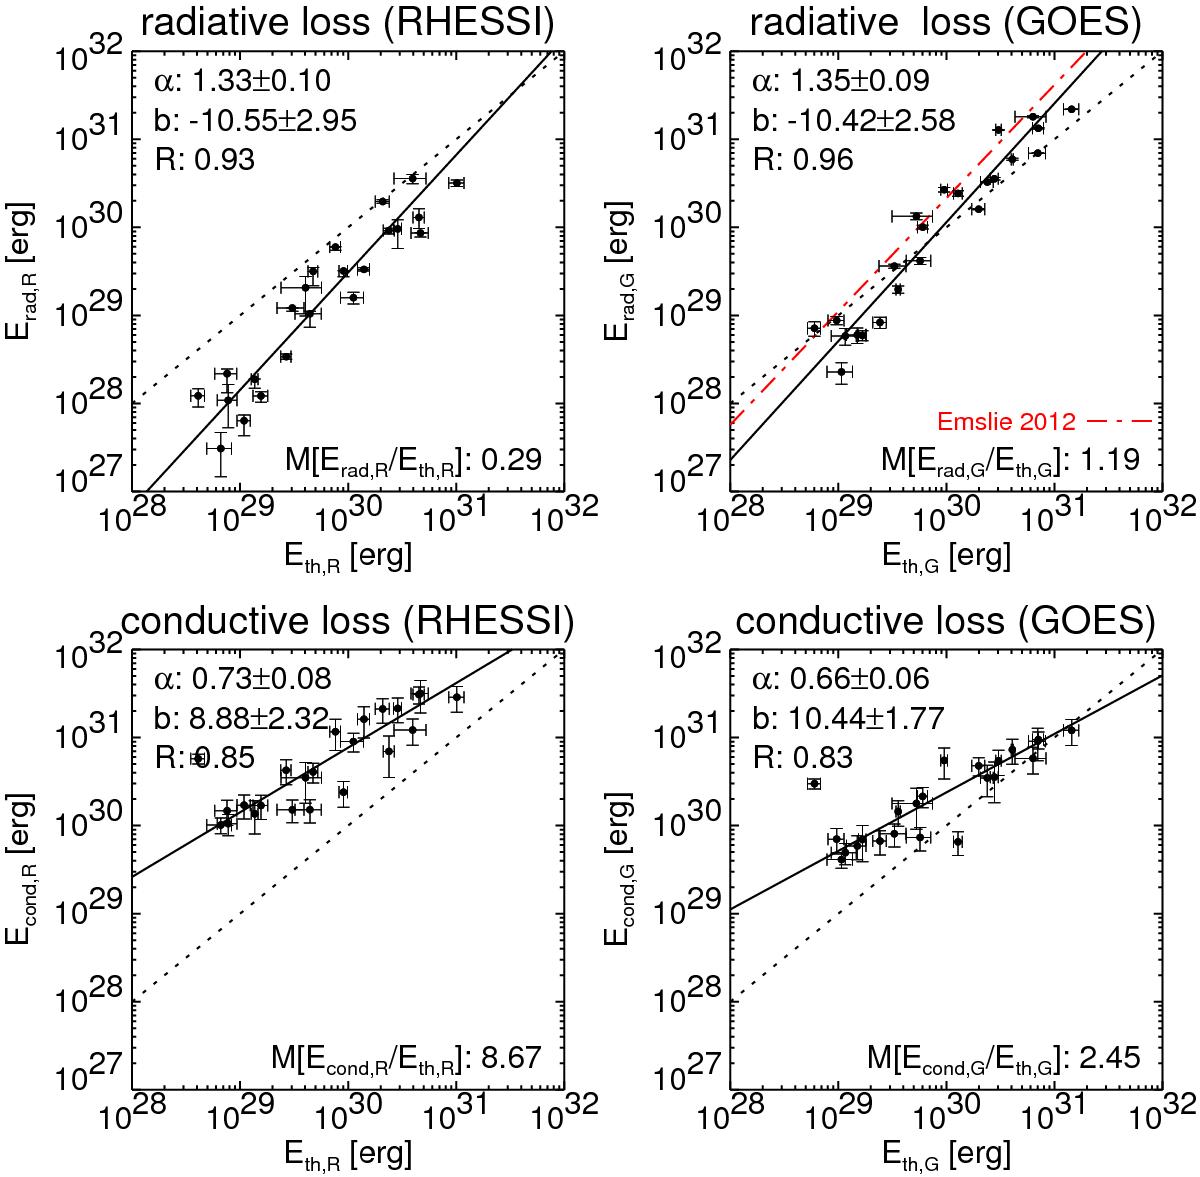
As in Fig. 5, but showing the radiative (top) and conductive energy loss (bottom) of the hot plasma, Erad and Econd, plotted versus maximum thermal energy Eth, derived from RHESSI (left) and GOES data (right). For the radiative energy loss given by GOES, the relation derived from Emslie et al. (2012) is shown by the dash-dotted line.
Current usage metrics show cumulative count of Article Views (full-text article views including HTML views, PDF and ePub downloads, according to the available data) and Abstracts Views on Vision4Press platform.
Data correspond to usage on the plateform after 2015. The current usage metrics is available 48-96 hours after online publication and is updated daily on week days.
Initial download of the metrics may take a while.