Fig. 5
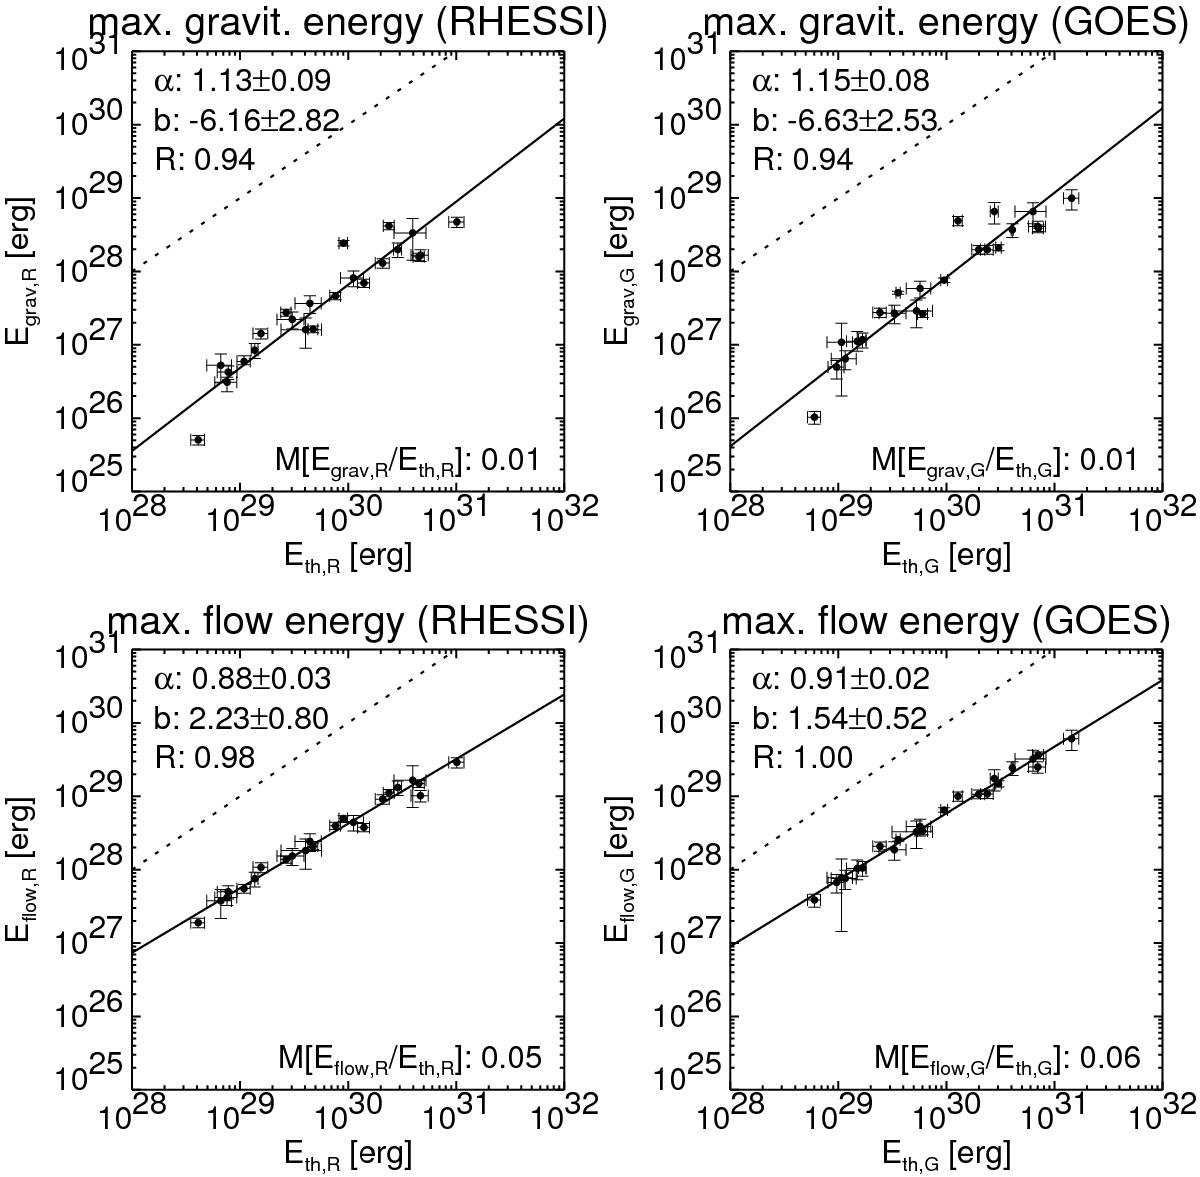
Maximum gravitational energy, Egrav (top) and maximum kinetic flow energy, Eflow (bottom) of the hot plasma plotted versus maximum thermal energy, Eth, derived from RHESSI (left) and GOES data (right). Power-law fits (full lines), the slope α and intercept b of the obtained power law, and the rank correlation coefficient R are also indicated. The dotted line denotes x = y, and the median ratio M of the different energies is indicated. Both gravitational and flow energies are significantly lower than the maximum thermal energies.
Current usage metrics show cumulative count of Article Views (full-text article views including HTML views, PDF and ePub downloads, according to the available data) and Abstracts Views on Vision4Press platform.
Data correspond to usage on the plateform after 2015. The current usage metrics is available 48-96 hours after online publication and is updated daily on week days.
Initial download of the metrics may take a while.