Fig. A.1
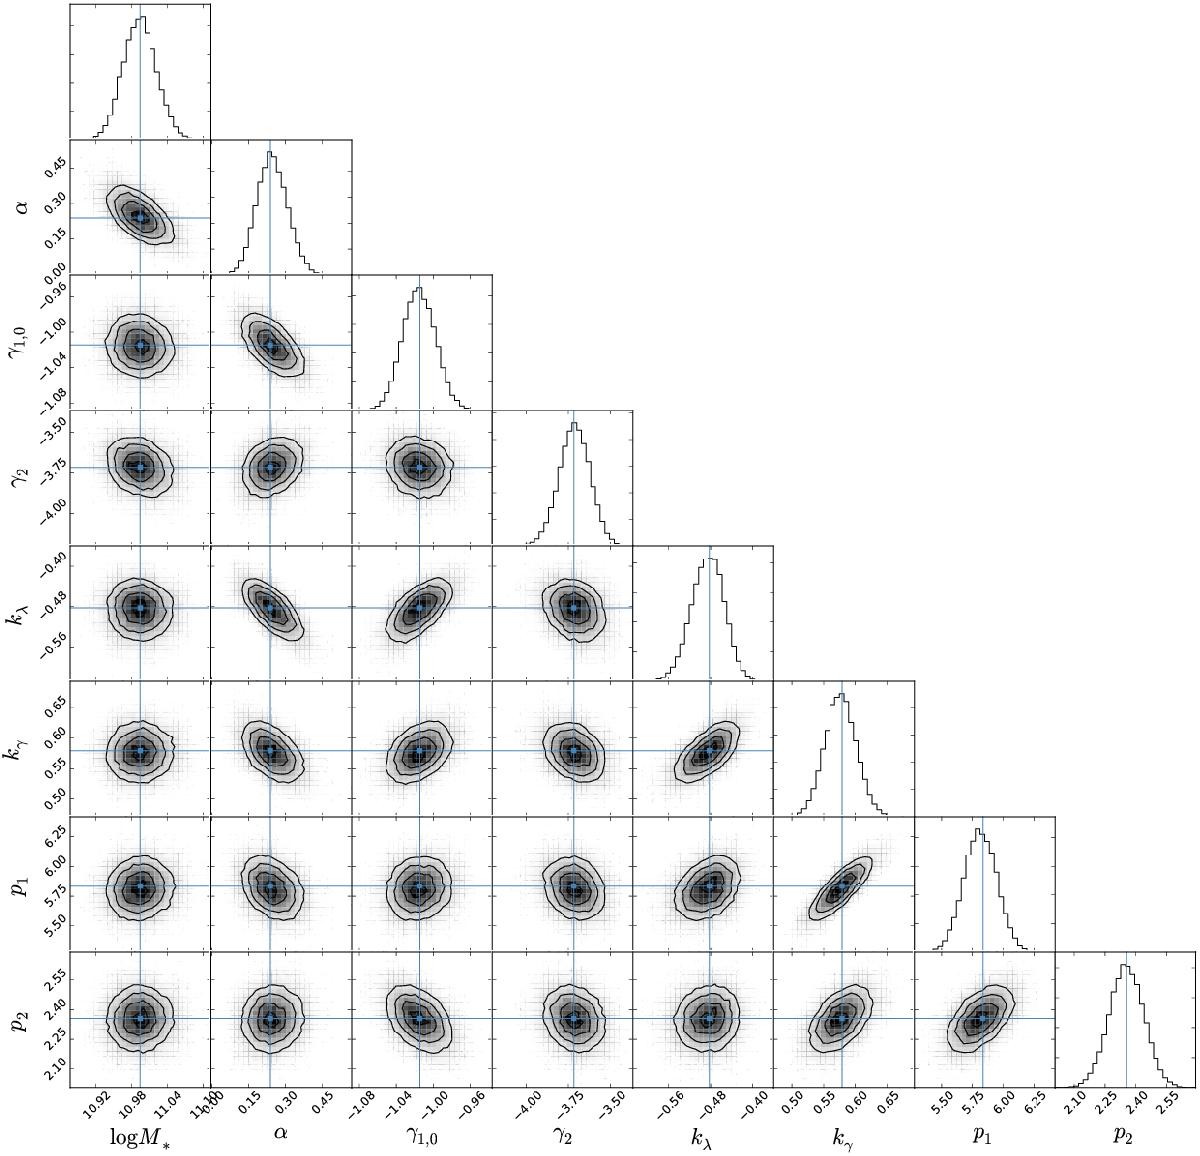
Posterior probability distribution for the free parameters of our best-fit model. The histograms at the top show the marginalized probability distribution function for each free parameter, while the contour plots show the marginalized 2D probability distribution function for each pair of parameters, to illustrate their covariances.
Current usage metrics show cumulative count of Article Views (full-text article views including HTML views, PDF and ePub downloads, according to the available data) and Abstracts Views on Vision4Press platform.
Data correspond to usage on the plateform after 2015. The current usage metrics is available 48-96 hours after online publication and is updated daily on week days.
Initial download of the metrics may take a while.