Fig. 3
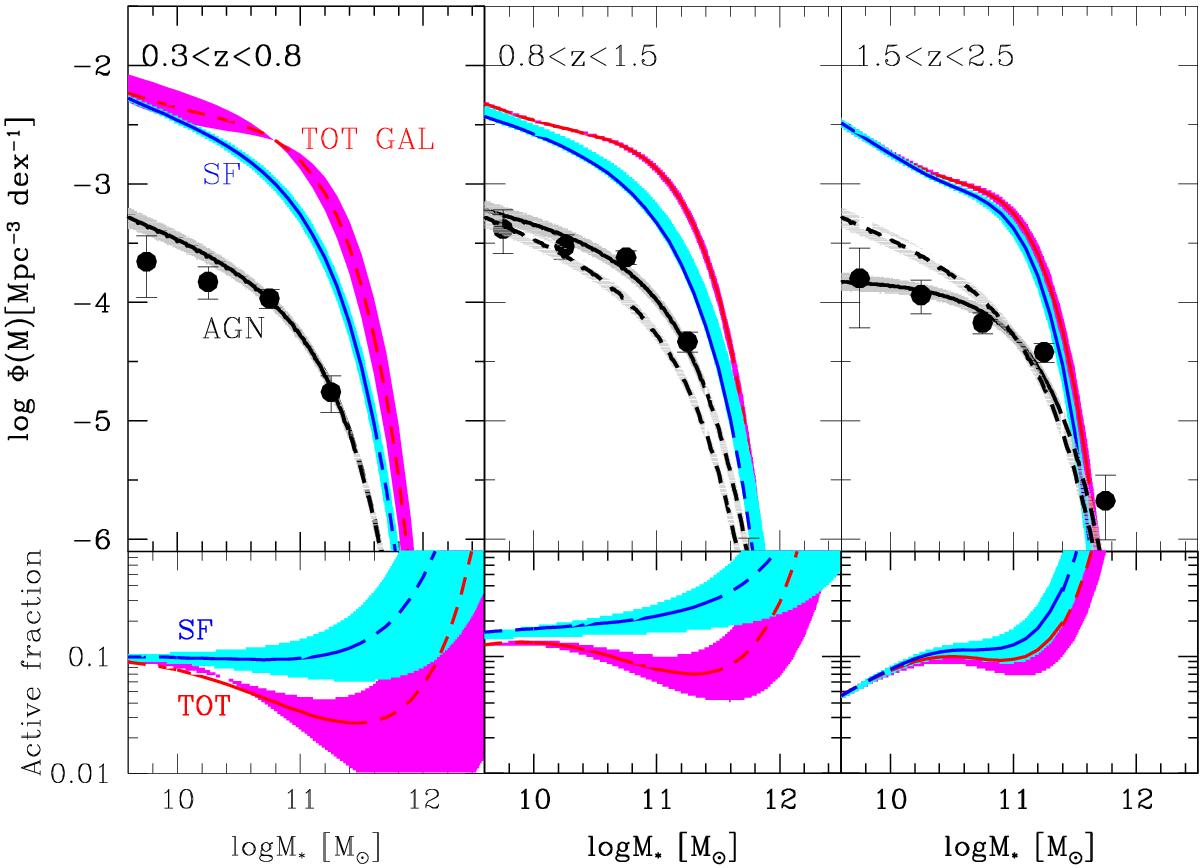
Upper panels: total AGN HGMF with the associated errors in three redshift bins derived through the maximum likelihood (black line and gray shaded area) and the Vmax (data points) methods. In each bin the lowest z fit is reported for reference with a dashed line. The red and blue lines are the total and the star-forming galaxy stellar mass functions with the associated errors (shown in magenta and cyan shaded areas) from Ilbert et al. (2013). Lower panels: ratio of AGN host galaxies to the total (red line) and the star-forming (blue line) galaxy population as a function of stellar mass in the same redshift bins.
Current usage metrics show cumulative count of Article Views (full-text article views including HTML views, PDF and ePub downloads, according to the available data) and Abstracts Views on Vision4Press platform.
Data correspond to usage on the plateform after 2015. The current usage metrics is available 48-96 hours after online publication and is updated daily on week days.
Initial download of the metrics may take a while.