Free Access
Fig. 2
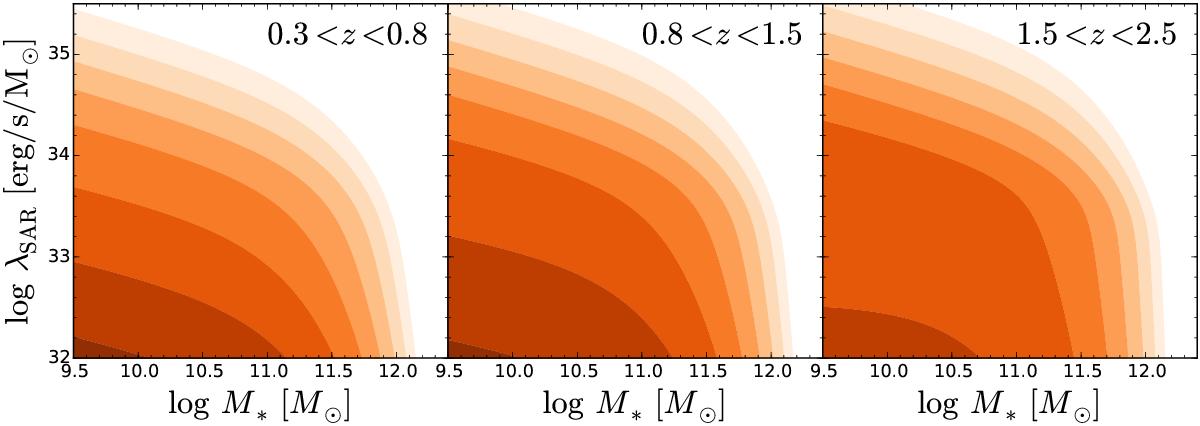
Bivariate distribution function Ψ(M⋆,λSAR,z), for our best-fitting parametric model, derived through the maximum likelihood method, in three redshifts bins. The orange contours indicate lines of constant space density (from 10-10 to 10-3 Mpc-3), separated by a factor of 10 each.
Current usage metrics show cumulative count of Article Views (full-text article views including HTML views, PDF and ePub downloads, according to the available data) and Abstracts Views on Vision4Press platform.
Data correspond to usage on the plateform after 2015. The current usage metrics is available 48-96 hours after online publication and is updated daily on week days.
Initial download of the metrics may take a while.